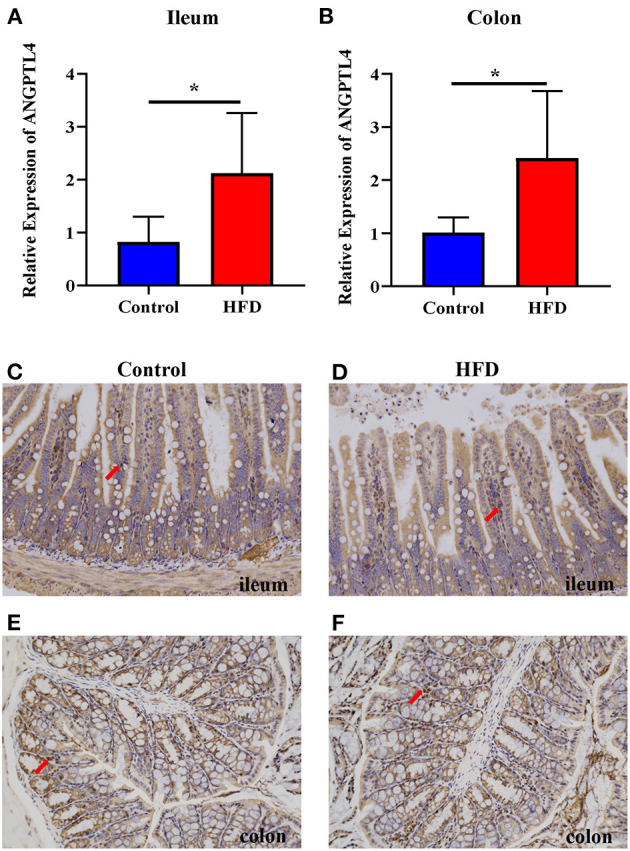
Figure 2.

The expression of ANGPTL4 in the ileum and colon of the Control and HFD groups. The mRNA expression level of ANGPTL4 was measured in the ileum (A) and colon (B) of mice in the Control and HFD groups using RT-qPCR analysis followed by RNA isolation. Sections of the ileum (C,D) and colon (E,F) in Control group (C,E) and HFD group (D,F) were stained with rabbit polyclonal antibodies to mouse ANGPTL4. The arrowhead points in the direction where ANGPTL4-positive cells are present. Data were expressed as mean ± SEM and statistically analyzed by using unpaired two-tailed Students’ t-test (n = 5). Asterisks (*) represent significant differences with P < 0.05.
