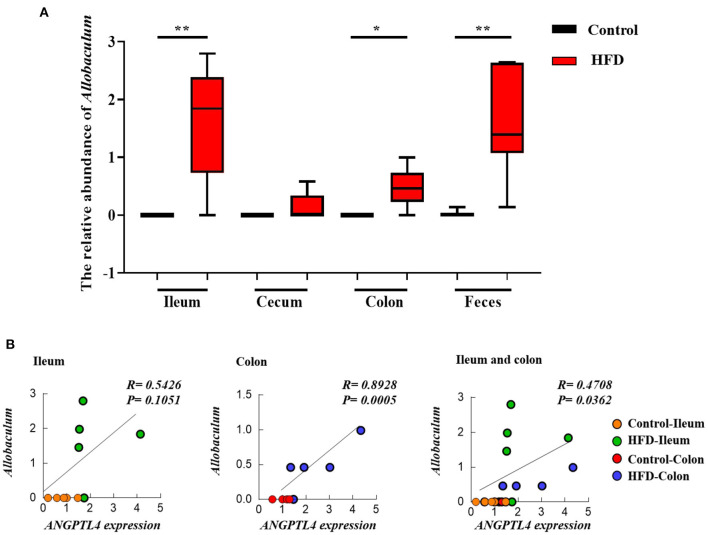
Figure 8.
The relative abundance of Allobaculum in ileum, cecum, colon, and feces of Control group and HFD group mice (A), and the correlation between the Allobaculum and ANGPTL4 expression (B) in ileum and colon. The data of cecum and feces were obtained from the NCBI database (DDBJ Accession Number: PRJDB7523 and NCBI Accession Number: SRP113647) (A). Asterisks (* and **) represent significant differences with P < 0.05 and P < 0.01, respectively.

