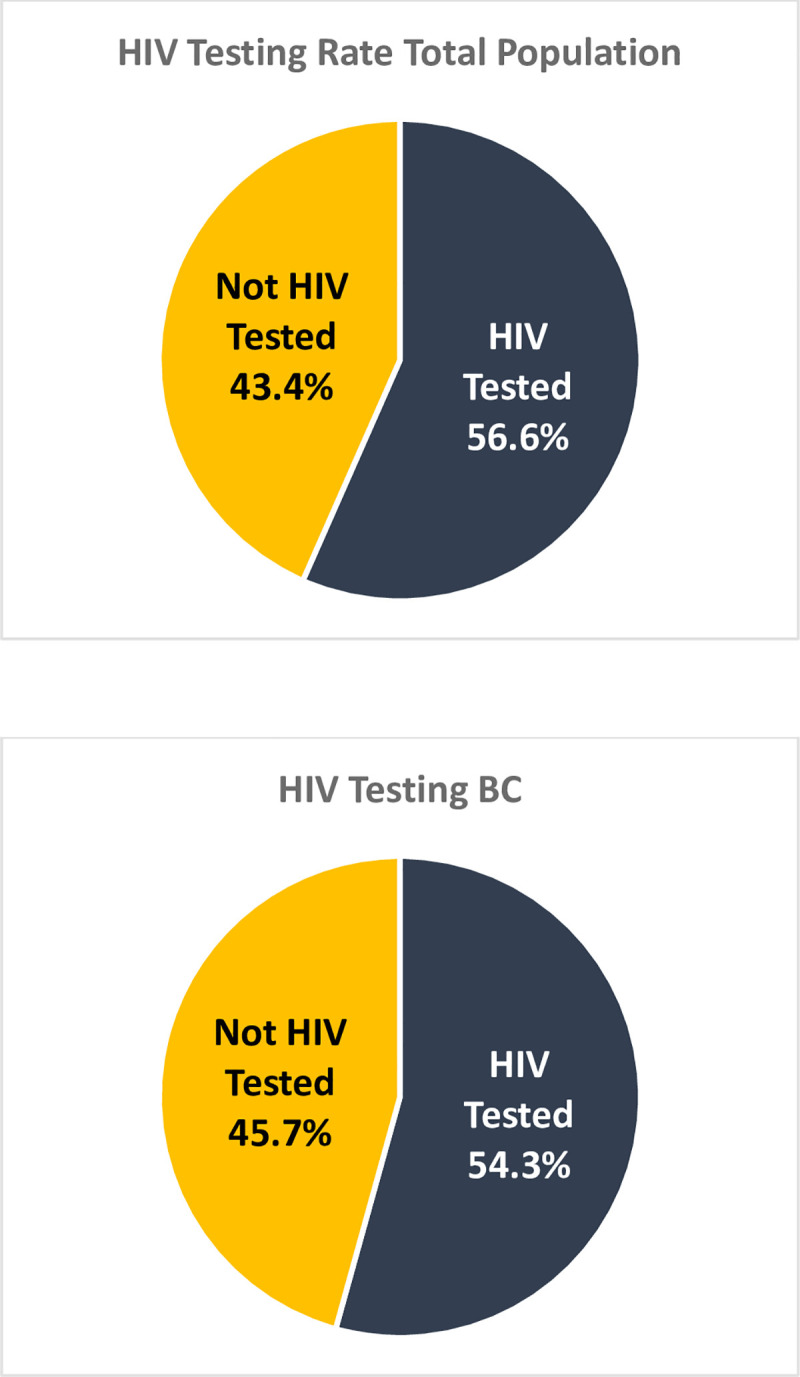
Fig 1. HIV testing in the HCV Ab+ population.

This figure illustrates the rates of HIV testing rates for those in BC, non-BC, and study as a whole. Patients were not more likely to be tested for HIV is they were in the non-BC compared to the BC (p = 0.09).
