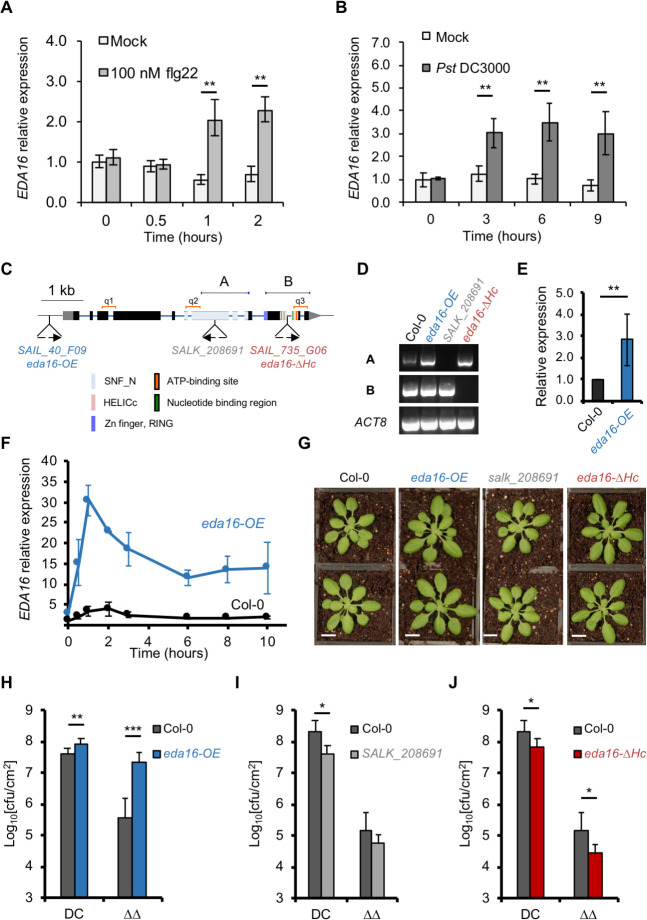
Fig 3. EDA16 is a negative regulator of plant immunity.
(A) EDA16 expression is induced by flg22 elicitation. Accumulation of EDA16 transcript was assessed by qPCR in 2-week-old Col-0 seedlings elicited with 100 nM flg22 or water (mock). Values are average of three biological repeats ± SE presented as fold induction compared with mock-treated sample at time 0. (B) Bacterial infection induces EDA16 expression. 5-week-old Col-0 plants were infiltrated with Pst DC3000 or 10 mM MgCl2 (mock). EDA16 expression was assessed by qPCR. Values are average of three biological repeats ± SE presented as fold induction compared with mock-treated sample at time 0. Labelled values are statistically different as established by two-sided T-test p-values: ** < 0.01. (C) Schematic representation of the T-DNA insertions in EDA16 gene. Boxes and solid lines denote exons and introns, respectively. T-DNA insertions and mutant names are indicated below the gene structure. The different functional domains of EDA16 are color-coded. Primers used for RT-PCR presented in panel D and corresponding PCR products are indicated above the gene structure (a, b). qPCR primers used in panels E and F are indicated above the gene structure (q1, q2, q3). (D) Mutant characterization by cDNA integrity. RT-PCR analysis of EDA16 gene expression in homozygous eda16 mutants and Col-0 plants. The amplified fragments (a and b) are indicated in C. ACT8 was used as a control. (E) SAIL_40_F09 mutant is an of EDA16 over-expresser. Accumulation of EDA16 transcript was assessed by qPCR in 2-week-old Col-0 and SAIL_40_F09 (eda16-OE) by averaging the results of 3 primer pairs (q1, q2 and q3), presented in panel C. Values are average of three biological repeats ± standard deviation presented as fold induction compared with Col-0 at time 0. (F) The SAIL_40_F09 mutant is an inducible over-expresser of EDA16. Accumulation of EDA16 transcript was assessed by qPCR in 2-week-old Col-0 and SAIL_40_F09 (eda16-OE) mutant plants as in panel E, after elicitation with 100 nM flg22 at the indicated times. Values are average of three biological repeats ± standard deviation presented as fold induction compared with Col-0 at time 0. (G) Representative pictures of 5-week-old eda16 mutants and Col-0 plants (bar = 1 cm). (H, I and J) The eda16 knock-out and over-expresser mutants have opposite immunity phenotypes. 5-week-old Col-0 (black), eda16-OE (blue), salk_208691 (grey) and eda16-ΔHc (red) plants were spray-inoculated with Pst DC3000 (DC) and Pst DC3000 ΔavrPtoΔavrPtoB (ΔΔ) as indicated. Bacterial numbers were determined 3 days post-infection. Error bars represent standard deviation (n = 6). The experiment was repeated 3 times with identical results. Labelled values are statistically different as established by two-sided T-test p-values: * < 0.05, ** < 0.01, *** < 0.001. Cfu stands for colony-forming units.

