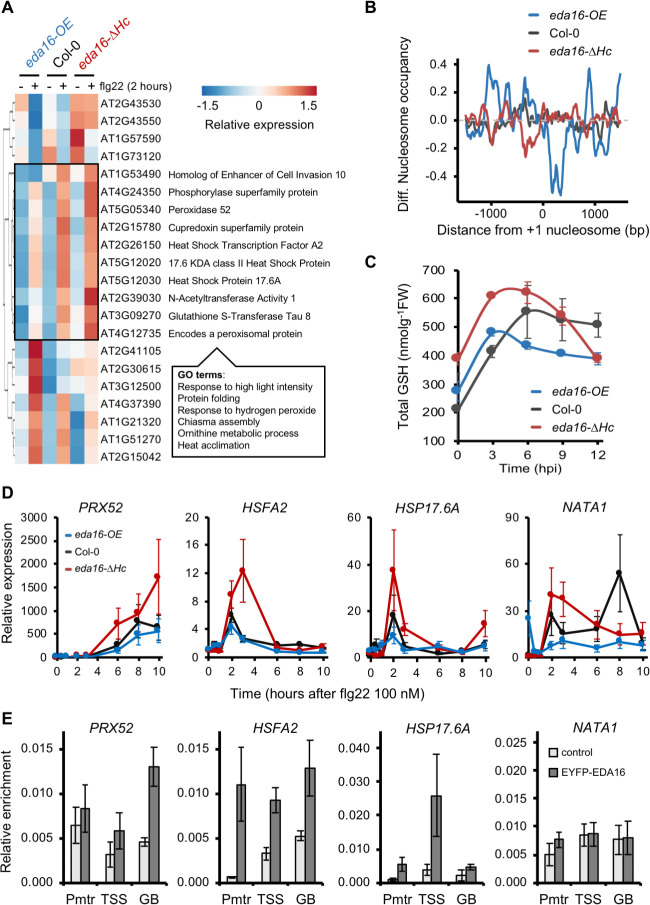
Fig 5. EDA16 regulates plant redox homeostasis during immune responses.
(A) EDA16 affects the expression of a subset of flg22-regulated genes. Heatmap of Differentially Expressed Genes between Col-0, eda16-OE and eda16-ΔHc plants 2h after elicitation with 100 nM flg22. The box on the heatmap indicates genes with a distinct pattern of misregulation in the eda16-OE and eda16-ΔHc mutant plants and accompanied with their (TAIR10) gene description. Most significant GO terms found for the intersection group. (B) Differential nucleosome occupancy of the 21 EDA16-flg22 DEGs. Differences between the average nucleosome occupancy of EDA16-regulated flg22-induced genes in Col-0 (grey), eda16-OE (blue), and eda16-ΔHc (red) 2 hours after elicitation with 100 nM flg22 and mock. The graph is centered on the +1 nucleosome from the gene TSS. (C) The EDA16 mutation alters glutathione concentration. Total glutathione (GSH) levels as concentration per fresh weight were measured in 3-week-old Col-0 (black), eda16-OE (blue) and eda16-ΔHc (red) plants at the indicated times following infection with Pst DC3000. Error bars represent standard deviation, n = 3. (D) EDA16 negatively regulate the expression of target genes. Gene expression of PRX52, HSFA, HSP17.6A and NATA1 assessed by qPCR in 2-week-old Col-0 (black) eda16-OE (blue) and eda16-ΔHc (red) seedlings elicited with 100 nM flg22. Values are average of three biological repeats ± SE presented as fold induction compared with Col-0 mock-treated sample at time 0. (E) EDA16 directly binds on target genes. ChIP-qPCR was performed on leaves from Col-0 and Col-0 35S::EDA16-YFP 5-week-old plants (n = 20) to assess EDA16 binding to PRX52, HSFA, HSP17.6A and NATA1. Three primer pairs were used for each gene corresponding to promoter region (Pmtr), TSS and gene body (GB). Values are average of three biological repeats ± SEM presented as relative enrichment compare to input.

