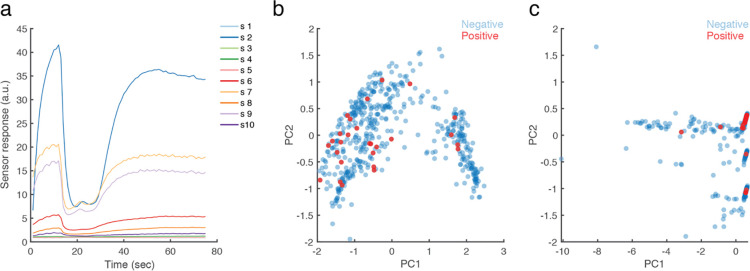
Fig 4. eNose measurements cluster SARS CoV-2 positive participants.
A. An example of the raw eNose measurement from one participant. Each line is one of 10 sensors. B. PCA of the equilibrium end-values only. C. PCA of the 3rd degree polynomial fit of the entire time-series. n = 503. The 27 positive samples are in red.

