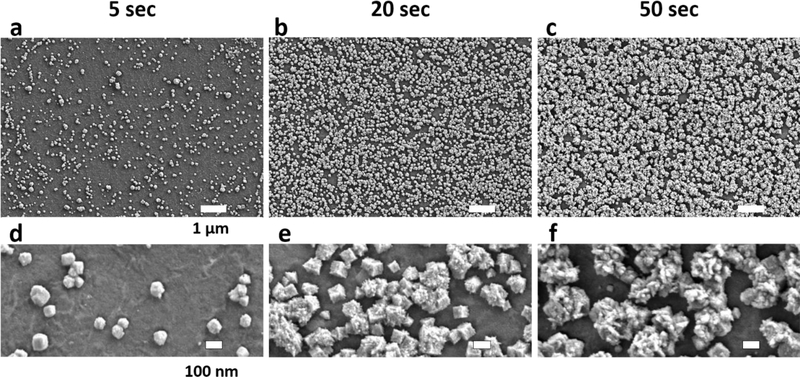
Figure 2.
Scanning Electron Microscope Images of PtNPs on Graphene. (a)-(c) show SEM images of PtNPs electrodeposited on graphene, the scale bar for these three panels is 1 μm. PtNPs cover 14.65%, 67.27%, and 88.22% of the graphene surface for 5, 20, 50 seconds depositions respectively. (d)-(e) show SEM images at a higher magnification to point out the size and shape of the PtNPs. The size of PtNP is less than 100 nm for 5 seconds deposition, 100–200 nm for 20 seconds, and above 250 nm for 50 seconds. Further, the surface roughness of the PtNPs also increases with deposition time.

