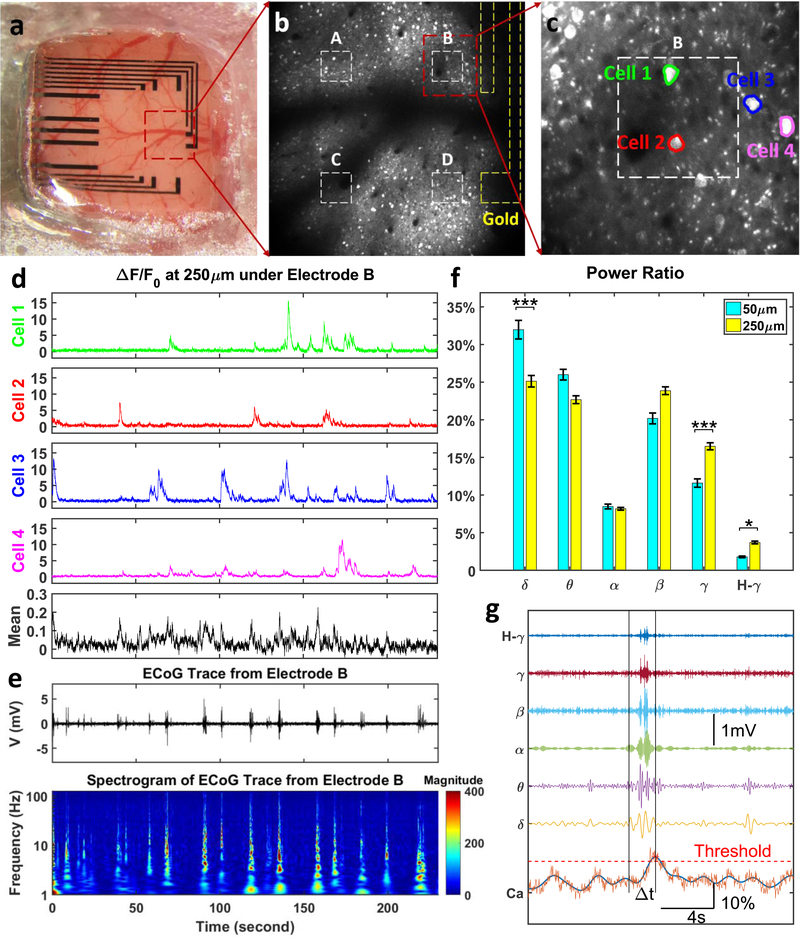
Figure 5.
Simultaneous in vivo Calcium Imaging and ECoG Recording. (a) The PtNP/graphene electrode array was placed on the cortex centered at 2.2 mm posterior and 2.1 mm lateral relative to bregma. (b) Two-photon microscope was focused at the depth of 250 μm from cortical surface to detect cell bodies, at the exact same location with 16x magnification. The deposition time for Electrode A, B, C, and D is 10, 50, 5, and 5 seconds respectively. (c) Multiple cells can be clearly imaged, Cell 1 and 2 are directly under the PtNP/graphene electrode, and Cell 3 and 4 outsides. The mean fluorescence change has a Region of Interest (ROI) the same as the electrode (white dashed box in Panel c). Fluorescence changes (d), ECoG trace and the spectrogram (e) were recorded and analyzed in a synchronized time frame. (f) The power ratio of ECoG oscillations at 50 μm calcium peak time is larger in lower frequency range (delta band) and smaller in higher frequency range (gamma and high gamma bands) than at 250um. (Kruskal-Wallis test, *** p < 0.001, * p < 0.05). (g) The power of the ECoG oscillations at each calcium peak time was calculated at delta band (δ, 1–4 Hz), theta band (θ, 4–8 Hz), alpha band (α, 9–12 Hz), beta band (β, 13–30 Hz), gamma band (γ, 30–100 Hz), and high gamma band (H-γ, >100 Hz).

