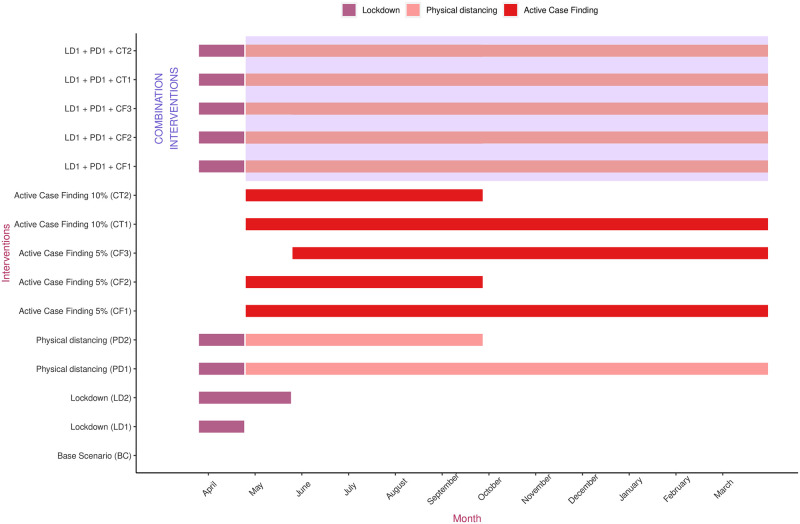
Fig 3. Timeline for the implementation of time-dependent interventions against COVID-19.
The y-axis labels represent various interventions that were considered. The colour coded horizontal bars represent the duration the respective intervention is in place. The area on the top shaded in blue represents a combination of interventions. Interventions begin with a lockdown that began on March 24. A one year time duration beginning March 24, 2020 has been considered in this study.

