Fig. 4.
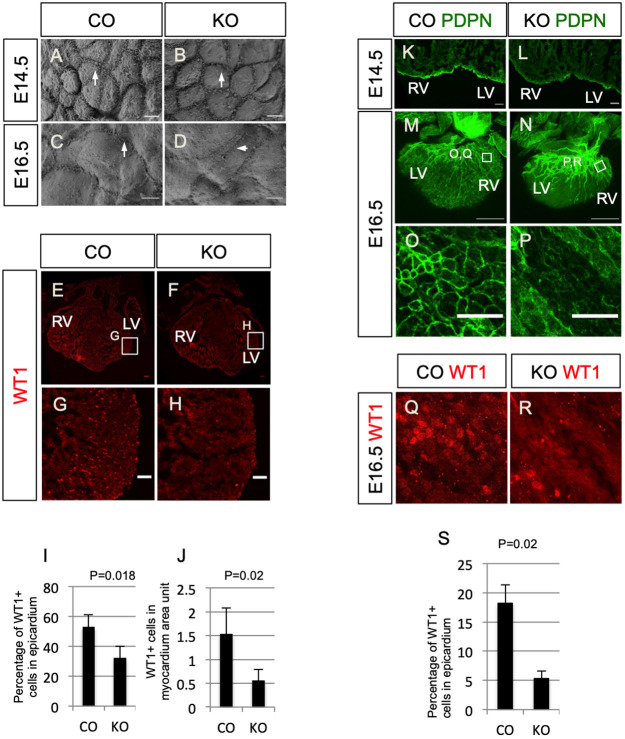
Loss of agrin results in developmental defects specifically in the epicardium. (A-D) Epicardial cells on the surface of E14.5 (A) and E16.5 (C) littermate controls (CO) and agrin KO hearts (B,D) hearts under SEM. Arrows in A-D indicate protrusions along cell-cell borders. (E,F) Immunofluorescence staining for WT1 (red) in E14.5 heart sections of the littermate control and agrin KO. (G,H) Magnified views of the boxed areas in E and F. (I) Quantification of WT1+ cells in the epicardium of control and KO hearts (percentage of WT1+ nuclei among epicardial cells). (J) Quantification of the number of WT1+ cells in a designated myocardium area. Data represent mean±s.e.m. n=3 hearts per group. (K,L) Immunofluorescence staining for podoplanin (PDPN, green) in E14.5 control (K) and agrin KO (L) sections. (M,N) Whole-mount immunofluorescence staining of E16.5 control (M) and agrin KO (N) hearts for podoplanin (green) labeling cardiac lymphatic vessels and epicardial cells. (O,P) Magnified views of the boxed areas in M and N. Note the downregulated epicardial podoplanin in agrin KO hearts. (Q,R) Whole-mount immunofluorescence staining for WT1 (red) of the same hearts shown in M and N at the same area as shown in O and P. (S) Quantification of the percentage of WT1+ cells in epicardium of E16.5 controls and agrin KO. Data represent mean±s.e.m. n=3 hearts per group. P-value was calculated using an unpaired, two-tailed Student's t-test. LV, left ventricle; RV, right ventricle. Scale bars: 5 μm (A-D); 50 μm (E-H,K,L,O,P); 500 μm (M,N).

