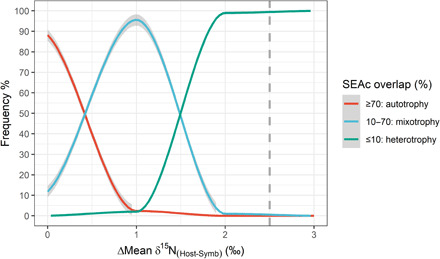
Fig. 1. Probability of the three cutoff values [suggested by (1)] resulting from the use of SIBER’s SEAc as a function of the difference between the mean δ15N isotopic values of the two considered groups (Host and Symbionts) [N = 40; ΣSD(Host-Symb) = 2‰].

Dotted line represents the values obtained for Platygyra sp. [∆Mean δ15N(Host-Symb) = 2.5‰; ΣSD(Host-Symb) = 2‰]. Results were obtained from 3500 simulations.
