
Fig. 2. Chances that a pooled dataset contains at least one subgroup with overlapping isotopic niches as a function of the difference between the mean isotopic values of the two considered groups (Host and Symbionts).
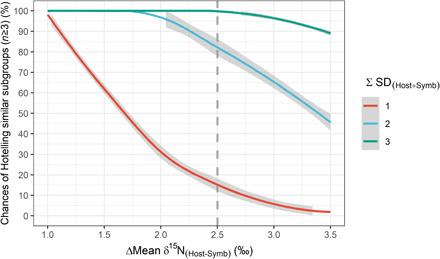
The curves correspond to different levels of SD associated with the means of the pooled fractions. Niche segregation is deduced from the P value of Hotelling tests (P > 0.05) for 182,000 simulated data per SD. Dotted line represents the values obtained for Platygyra sp. [ΔMean δ15N(Host-Symb) = 2.5‰ and ΣSD(Host-Symb) = 2].