
Fig. 2. Selective excitation of the light-induced coherent dynamics.
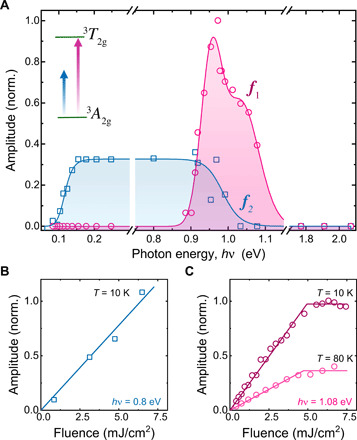
(A) Amplitudes of the coherent oscillations corresponding to the modes at frequencies f1,2 normalized to the maximal value of the f1 mode as a function of the pump photon energy. Solid lines are guides to the eye. Inset: Schematic illustration of the optical transition at which the f1 mode is observed. (B and C) Amplitude of the oscillation as a function of the pump fluence for the (B) f2 and (C) f1 modes. The solid lines are linear fits, including saturation.