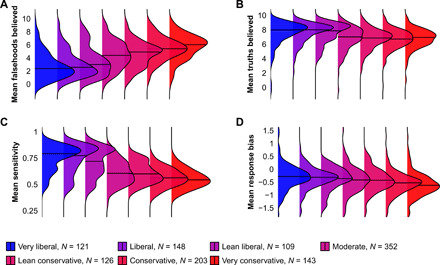
Fig. 1. Probability density estimates by ideology.

(A) The number of falsehoods believed, (B) the number of truths believed, (C) sensitivity, and (D) response bias.

(A) The number of falsehoods believed, (B) the number of truths believed, (C) sensitivity, and (D) response bias.