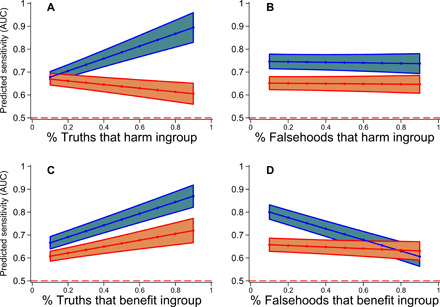
Fig. 4. Sensitivity by ideological implications and veracity.

Estimated marginal means based on fixed effects regression comparing strong liberals (blue) to strong conservatives (red). The red dashed lines denotes the performance of a random classifier. (A) Liberals’ sensitivity increases more rapidly than conservatives’ as the proportion of truths harming the ingroup increases. (B) Conservatives’ and liberals’ sensitivity is unrelated to the proportion of ingroup-harming falsehoods. (C) Liberals’ sensitivity increases more rapidly than conservatives’ as the proportion of truths benefiting the ingroup increases. (D) Liberals’ sensitivity declines more rapidly than conservatives’ as the proportion of falsehoods benefiting the ingroup increases.
