
Fig. 2. Biogenesis of DS-EXOs based on the MGE-mediated click chemistry of ADSCs.
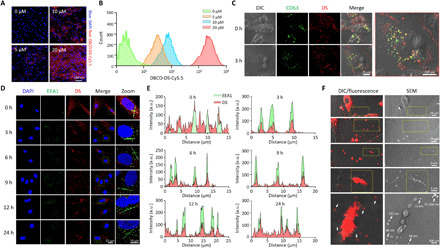
(A) Confocal microscopic images of DS-modified ADSCs at different concentrations of Ac4ManNAz. For the MGE-mediated click chemistry, ADSCs were incubated with Ac4ManNAz for 48 hours to generate azide groups on the surface and then treated with serum-free medium containing Cy5.5-labeled DBCO-DS (10 μM) for 2 hours. (B) Quantification of the DS on the ADSCs at different concentrations of Ac4ManNAz. Modified ADSCs were analyzed by flow cytometry to quantify the azide surface expression. (C) Intracellular tracking of DS in MDA-MB-231-CD63-GFP cells. The CD63-GFP cell line was used for MGE-mediated click chemistry to confirm the intracellular colocalization of CD63 and DS during biogenesis. Confocal microscopy images show CD63-GFP (green) and Cy5.5-labeled DS (red) in the MDA-MB-231-CD63-GFP cells. (D) Intracellular tracking of DS in the ADSCs. Time-dependent fluorescence images of the early endosomes and DS were obtained after the MGE-mediated click chemistry of ADSC. Confocal microscopy images show EEA1 (green) and Cy5.5-labeled DS (red) in the ADSCs. (E) Kinetic quantification of confocal imaging in (D). a.u., arbitrary units. (F) Secretion of the DS-decorated extracellular vesicles from the ADSCs. To visualize the extracellular secretion of the DS-decorated extracellular vesicles, the ADSCs were seeded onto a High Grid-500 glass-bottom μ-Dish. After the MGE-mediated click chemistry, images were separately obtained for the same spot using SEM and confocal microscopy. The dotted region in the top panel is magnified in the bottom panel.