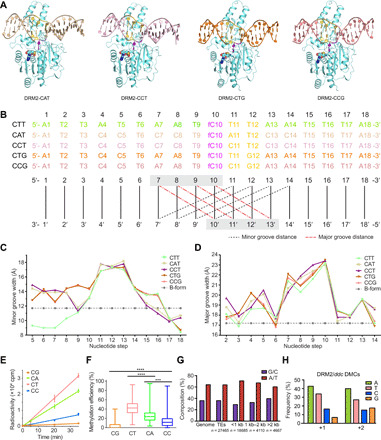
Fig. 3. Shape analysis of DRM2-bound DNAs.

(A) Crystal structures of DRM2 in complex with CAT, CCT, CTG, and CCG DNAs, respectively. (B) DNA sequences of the target strand for methylation in each structure. Minor groove widths (dashed lines in black) and major groove widths (dashed lines in red) are determined by measuring the cross-strand distances of the two phosphate groups of the nucleotides at indicated positions, as illustrated in the schematic below the DNA sequences. (C and D) DNA sequence–dependent minor groove widths (C) and major groove widths (D) of the DRM2-bound DNAs in the DRM2-CTT, DRM2-CAT, DRM2-CCT, DRM2-CTG, and DRM2-CCG complexes. Dashed lines show the canonical groove widths for B-form DNA. (E) In vitro methylation kinetics of DRM2 on the 30-mer DNA containing a single CG, CA, CC, or CT site. Data are means ± SD (n = 3 replicates). (F) Box plot comparing the methylation efficiencies of DRM2 on the CG/CH sites of a 637-bp DNA fragment based on bisulfite sequencing analysis, with 25 to 75% in the box, entire range for the whiskers, and median indicated. In total, 56 clones, including 28 for the upper strand and 28 for the lower strand, were analyzed. Two-tailed Student’s t tests were performed to compare distributions between different groups. ***P < 0.001 and ****P < 0.0001. (G) Histogram showing the percent A/T versus G/C composition of the Arabidopsis genome in comparison to all TEs and TEs of different sizes. (H) Quantification of the nucleotide frequency of the first base pair downstream (+1) and the second base pair downstream (+2) of all hyper differentially methylated cytosines (DMCs) called against ddc.
