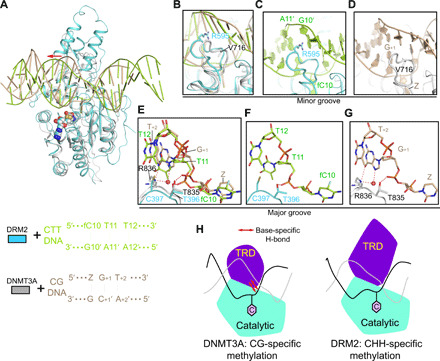
Fig. 4. Structural comparison of the DRM2-DNA and DNMT3A-DNA complexes.

(A) Structural overlay of DRM2-CTT complex (cyan) and DNMT3A-CGT DNA complex (gray; Protein Data Bank: 5YX2). For clarity, only one DNMT3A molecule and associated DNA are shown. Z, cytosine analog zebularine. The differential major groove distortion between DRM2- and DNMT3A-bound DNAs is indicated by a red arrow. (B) Distinct catalytic loop–DNA contact between DRM2-CTT and DNMT3A-CGT complexes. (C) Close-up view of the R595-mediated intercalation in DRM2-CTT complex. (D) Close-up view of the V716-CG DNA contact in DNMT3A-CGT complex. (E) Structural comparison of the TRD loop–DNA contact between DRM2-CTT and DNMT3A-CGT complexes. Hydrogen bonds are shown as dashed lines. (F) Close-up view of the DNA contacts by T396 and C397 in the DRM2-CTT complex. (G) Close-up view of the DNA contacts by T835 and R836 in the DNMT3A-CGT complex. (H) Model for the distinct substrate recognition mechanisms between DRM2 and DNMT3A. The TRD of DNMT3A engages base-specific hydrogen-bonding interactions with CG site (left), whereas the TRD of DRM2 interacts with deformed major groove via shape complementarity (right), thereby accommodating substrate diversity. The target cytosine is shown as a pink hexagon.
