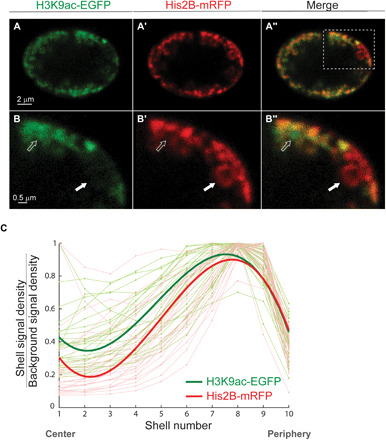
Fig. 4. Live labeling of active chromatin regions shows spatial overlap with His2B-mRFP–labeled chromatin compartment at the nuclear periphery.

(A) H3K9ac-EGFP mintbody expressed in the live larva muscle nucleus demonstrates peripheral distribution of the euchromatin, similar to the His2B-mRFP spatial distribution of the total chromatin. (A′) Merged image of active and total chromatin (A″); boxed area is enlarged in the bottom (B, B′, and B″). Solid white arrow points to a dense heterochromatin with strong His2B-mRFP signal (B′) and weak H3K9ac-EGFP (B). Hollow arrow points to an active region with strong H3K9ac-EGFP signal and diffused chromatin emphasized by weak His2B-mRFP. These regions coexist in the same radial layer but at different positions perpendicular to the radial direction. (C) H3K9ac (light green) and His2B (light red) signal density for each shell, normalized by background signal density, is plotted from center to periphery. Each light line represents a single nucleus, with signal normalized to maximum value (n = 27). Bold lines represent the fitted average, with peak signal at the periphery of the nucleus for both active and overall chromatin.
