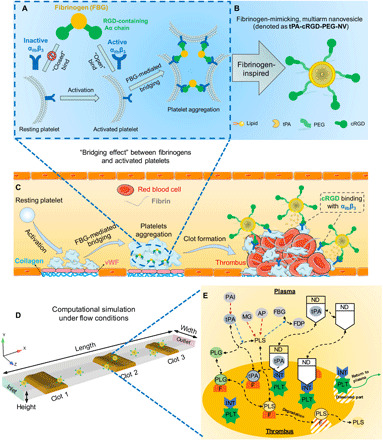
Fig. 1. Schematic illustrations of platelet aggregation, thrombus formation and targeted thrombolysis, and the computational model under flow conditions.

(A) Schematic illustration of the mechanism of platelet aggregation through the “bridging effect” between fibrinogen and activated platelets. (B) Schematic illustration of a fibrinogen-mimicking, multiarm lipid nanovesicle, which is denoted as tPA-cRGD-PEG-NV. (C) Schematic illustration of thrombus formation and targeted thrombolysis through tPA-cRGD-PEG-NV mediated thrombus-specific delivery and triggered release of tPA. (D) The computational model under flow conditions, which consists of a rectangular channel with initial thrombi artificially created at three locations (clots 1 to 3). The height (0.1 mm) and width (0.4 mm) of the channel match the microfluidics model in our experiment. The length (3.5 mm) is arbitrarily chosen, since the actual microfluidics channel (280 mm in length) is excessively long compared to its height. The volumes of clots 1, 2, and 3 are 4.5 × 10⁻³, 7.2 × 10⁻³, and 4.5 × 10⁻³ mm3, respectively. (E) A schematic diagram of reactions taking place in the plasma and within a thrombus. PLG, plasminogen; PLS, plasmin; AP, α2–anti-PLS; MG, α2-macroglobulin; FBG, fibrinogen; FDP, fibrin degradation product; PAI, plasminogen activator inhibitor-1; PLT, activated platelets; INTs, αIIbβ3 integrins; F, fibrin fiber binding sites; ND, nanodrug of tPA-cRGD-PEG-NV. Black dashed lines denote reaction kinetics and can describe either a reversible or irreversible reaction depending on the arrow type. Blue dashed arrows represent enzymatic action in a conversion reaction. Red dashed arrows indicate inactivation of a pointed species by a pointing species, i.e., AP and MG inactivate PLS, while PAI inhibits tPA. FBG is included in the model as its low level in the plasma indicates a risk of bleeding.
