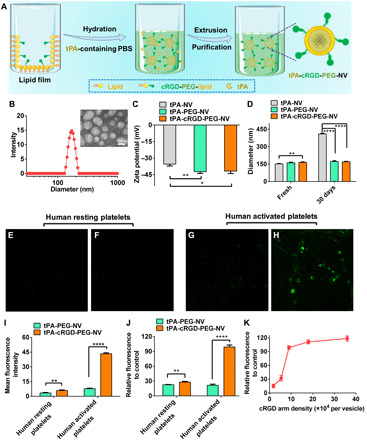
Fig. 2. Preparation, characterization, and selective binding of tPA-cRGD-PEG-NV.

(A) Schematic representation of the preparation process of tPA-cRGD-PEG-NV. (B) Typical DLS plot of tPA-cRGD-PEG-NV in PBS buffer (pH 7.4). Inset: representative TEM image of tPA-cRGD-PEG-NV. Scale bar, 100 nm. (C) Zeta potential of tPA-NV, tPA-PEG-NV, and tPA-cRGD-PEG-NV. (D) Particle size change of tPA-NV, tPA-PEG-NV, and tPA-cRGD-PEG-NV after storage at 4°C for 30 days. CLSM images of human resting platelets incubated with the FITC-labeled (E) tPA-PEG-NV and (F) tPA-cRGD-PEG-NV. CLSM images of human activated platelets incubated with the FITC-labeled (G) tPA-PEG-NV and (H) tPA-cRGD-PEG-NV. (I) Mean fluorescence intensity of FITC in the CLSM images of human resting and activated platelets after incubation with the FITC-labeled tPA-PEG-NV and tPA-cRGD-PEG-NV, respectively, as analyzed by ImageJ. (J) Relative fluorescence intensity of human resting and activated platelets treated with the FITC-labeled tPA-PEG-NV and tPA-cRGD-PEG-NV, respectively, as measured by flow cytometry. (K) Relative fluorescence intensity of human activated platelets incubated with the FITC-labeled tPA-cRGD-PEG-NV containing different cRGD arm densities, as measured by flow cytometry. Data are presented as the average ± SD (n = 3). Statistical analysis for Fig. 2 (C and D) was performed using the analysis of variance (ANOVA) (multiple comparisons) test, while the Student’s t test for Fig. 2 (I and J). *P < 0.05, **P < 0.01, and ****P < 0.0001, respectively.
