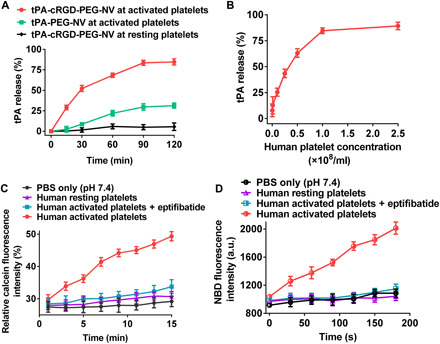
Fig. 4. Triggered drug release and release mechanisms.

(A) tPA release profiles of tPA-PEG-NV and tPA-cRGD-PEG-NV after incubation with human resting or activated platelets (1.0 × 10⁸/ml). (B) tPA release profiles of tPA-cRGD-PEG-NV after incubation with different concentrations of human activated platelets for 2 hours. (C) Real-time monitoring of the relative calcein fluorescence intensity after incubation of the calcein-carrying cRGD-PEG-NV (self-quenching concentration of calcein at 50 mM) with PBS buffer only, human resting platelets, human activated platelets, and eptifibatide-pretreated human activated platelets, respectively. (D) Real-time monitoring of the NBD fluorescence intensity of after incubation of the NBD [1 mole percent (mol %)]– and Rhod (1 mol %)–coated cRGD-PEG-NV with PBS buffer only, human resting platelets, human activated platelets, and eptifibatide-pretreated human activated platelets, respectively. Data are presented as the average ± SD (n = 3).
