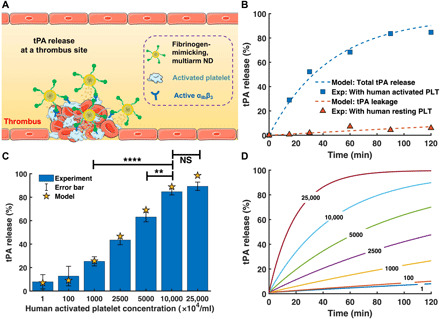
Fig. 6. Computational simulation results under static conditions.

(A) Schematic illustration of activated platelet-triggered tPA release specifically at a thrombus site using the fibrinogen-mimicking, multiarm ND. (B) Comparison of tPA release from the ND between model predictions and experiments with human resting and activated platelets at 1 × 10⁸/ml. (C) Comparison of tPA release from the ND between model predictions and experiments at different concentrations of human activated platelets after incubation for 2 hours. Experiment data are presented as the average ± SD (n = 3). Statistical analysis for experiment data was performed using the ANOVA (multiple comparisons) test. **P < 0.01 and ****P < 0.0001, respectively. (D) Predictions of time-dependent tPA release from the ND at different concentrations of human activated platelets. Numbers on each curve indicate the concentrations of human activated platelets in (×104/ml).
