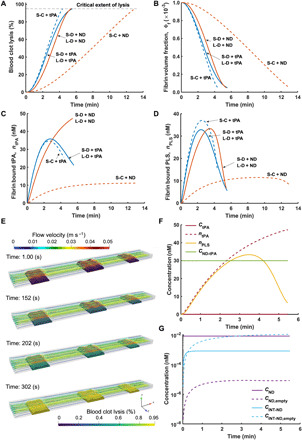
Fig. 8. Simulation results for targeted thrombolysis under flow conditions.

(A) to (D) are the results for all six scenarios with varying thrombus size, platelet density, and drug type [blue dashed line, small coarse thrombi with free tPA (S-C + tPA); orange dashed line, small coarse thrombi with the ND (S-C + ND); blue solid line, small dense thrombi with free tPA (S-D + tPA); orange solid line, small dense thrombi with the ND (S-D + ND); blue dotted line, large dense thrombi with free tPA (L-D + tPA); orange dotted line, large dense thrombi with the ND (L-D + ND)]. In (A) to (D), results for the small and large dense thrombi are indistinguishable. (A) Real-time changes in the extent of thrombolysis. (B) Real-time changes in the fibrin volume fraction. (C) Real-time changes in the concentration of fibrin-bound tPA. (D) Real-time changes in the concentration of fibrin-bound PLS. (E to G) Large dense thrombi treated with the ND. (E) Local extent of thrombolysis and flow velocity at different times for the case of large dense thrombi with the ND. (F) Temporal concentrations of tPA in the plasma phase (CtPA), fibrin-bound tPA (ntPA), fibrin-bound PLS (nPLS), and encapsulated tPA in the ND (CND-tPA). (G) Temporal concentrations of the ND loaded with tPA (CND), the empty ND (CND,empty), INT-bound ND (CINT-ND), and INT-bound empty ND (CINT-ND,empty). Each variable displayed in (A) to (D), (F), and (G) represents its average value over the clot volume.
