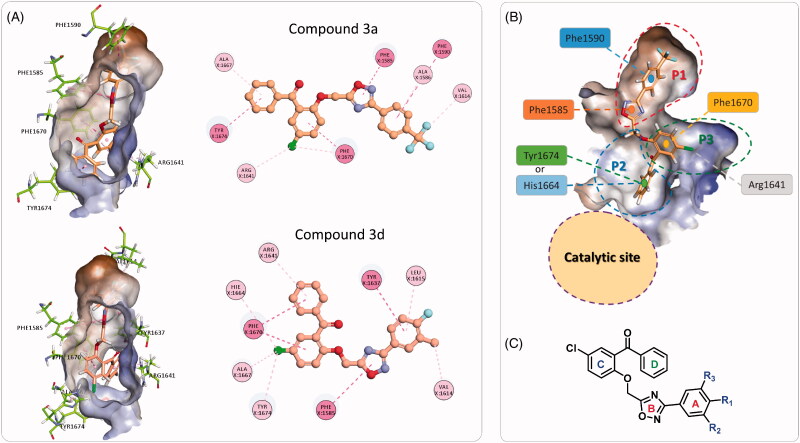
Figure 7.
(A) The two binding modes of the designed compounds illustrated by the compounds 3a and 3d. For each compound, the 3 D binding mode is shown along with its 2 D interaction map, see Figure 5 for the key. (B) Detailed analysis of the Pks13-TE binding groove showing the catalytic site, and the substrate binding site with its three sub-pockets. (C) The general structure of the designed compounds.

