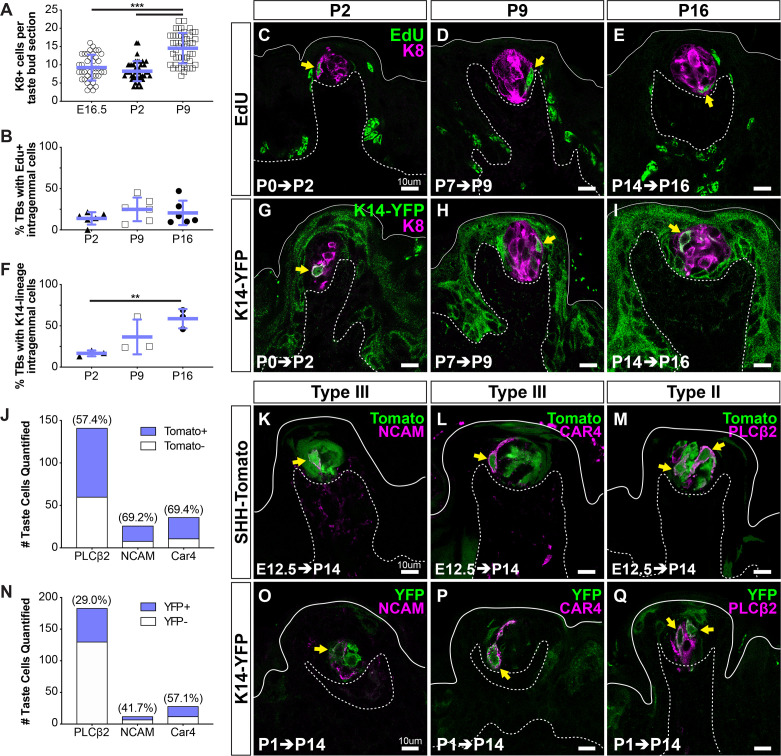
Figure 2. KRT14+ progenitor contribution of new cells to taste buds begins at birth.
(A) Quantification of KRT8+ cells per FFP section reveals taste bud cell number does not increase until P9. Blue bars: mean ± SD (n = 3 animals per stage, 8–18 taste buds per animal, open and shaded shapes) Student’s t-test ***p<0.001. (B–E) In pups that received EdU at P0, P7, or P9, analysis at 48 hr revealed comparable proportions of taste buds housed newly generated EdU+/KRT8+ cells (yellow arrows in C–E) regardless of postnatal day of labeling (EdU green, KRT8 magenta). (F–I) Lineage tracing with Krt14CreERT2; R26RYFP (KRT14-YFP) initiated at P0, P7, or P14 assessed at 48 hr showed extensive YFP expression (green) in FFP non-taste epithelium as well as YFP+/KRT8+ cells in taste buds (magenta, yellow arrows in G–I). (C–E, G–I) Dashed lines delimit the basement membrane; solid lines delimit the epithelial surface. (B, F) Blue bars: mean ± SD Student’s t-test **p<0.005 (B: n = 6 animals per stage, 14–28 taste buds per animal; F: n = 3 animals per stage, 10–24 taste buds per animal). (J–M) SHH+ taste precursor cells are not lineage restricted. ShhCreERT2; R26RtdTomato (SHH-Tomato, green) mice treated with TAM at E12.5 reveals similar proportions of type III (NCAM+, CAR4+ magenta in K, L) and type II (PLCß2+ magenta in M) taste cells are tomato+ (green) (N = 3 mice, counts from 24 NCAM+, 30 CAR4+ and 30 PLCß2+ total TBs). (N–Q) Postnatally activated KRT14+ progenitors are not lineage restricted. Krt14CreERT2;R26RYFP (K14-YFP, green) mice treated with TAM at P1 labels both type III (NCAM+, CAR4+ magenta in O, P) and type II (PLCß2 magenta in Q). Double labeled cells indicated with yellow arrows in all image panels. Dashed lines delimit the basement membrane; solid lines delimit the epithelial surface.

