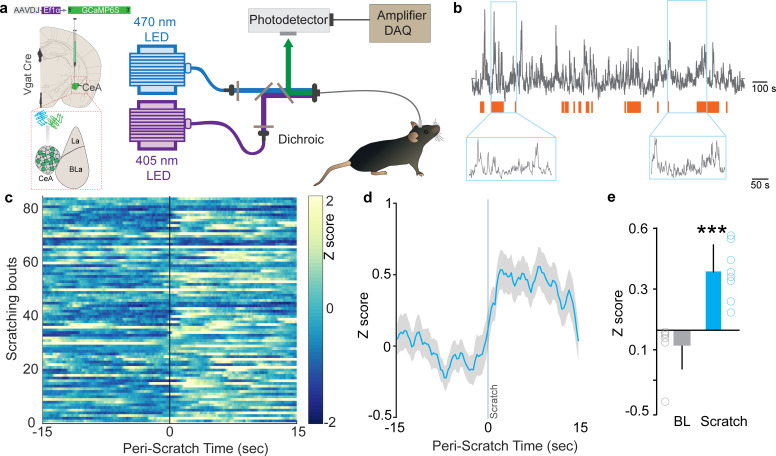
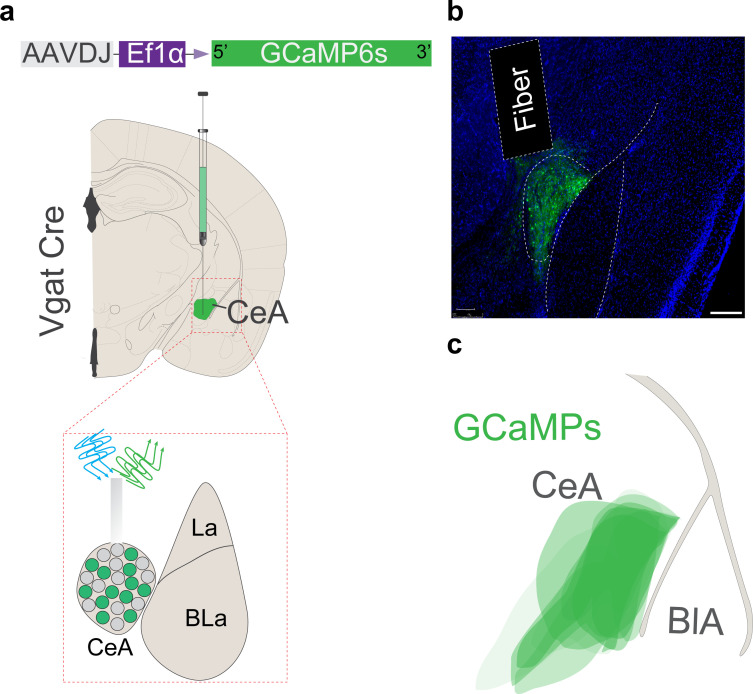
Figure 1. Neural dynamics of itch activated with central amygdala (CeA) neurons.
(a) Scheme demonstrating viral injection strategy and fiber placement to record CeA Vgat neural activity in response to chloroquine. (b) Raw Ca2+ dynamics recorded from CeA Vgat neurons and their relationship to chloroquine-evoked scratching bouts (orange bars). (c) Heatmap showing Ca2+ dynamics of all trials of Vgat+ve vlPAG neurons relative to the initiation of chloroquine-evoked scratching bouts (time zero). (d) Averaged GCaMP6s fluorescence signal of CeA Vgat neurons showing rapid increases in fluorescence on the initiation of scratching bouts. Trace plotted as mean (blue line) ± SEM (gray shading), and the vertical line indicates initiation of scratching bouts. (e) Chloroquine-evoked scratching resulted in a significant increase in CeA Vgat neuronal activity as measured by this change in GCaMP6s fluorescence (N = 8, t test, t = 5.923, df = 14, p<0.0001).


