
Fig. 3. Structure of acacp3U.
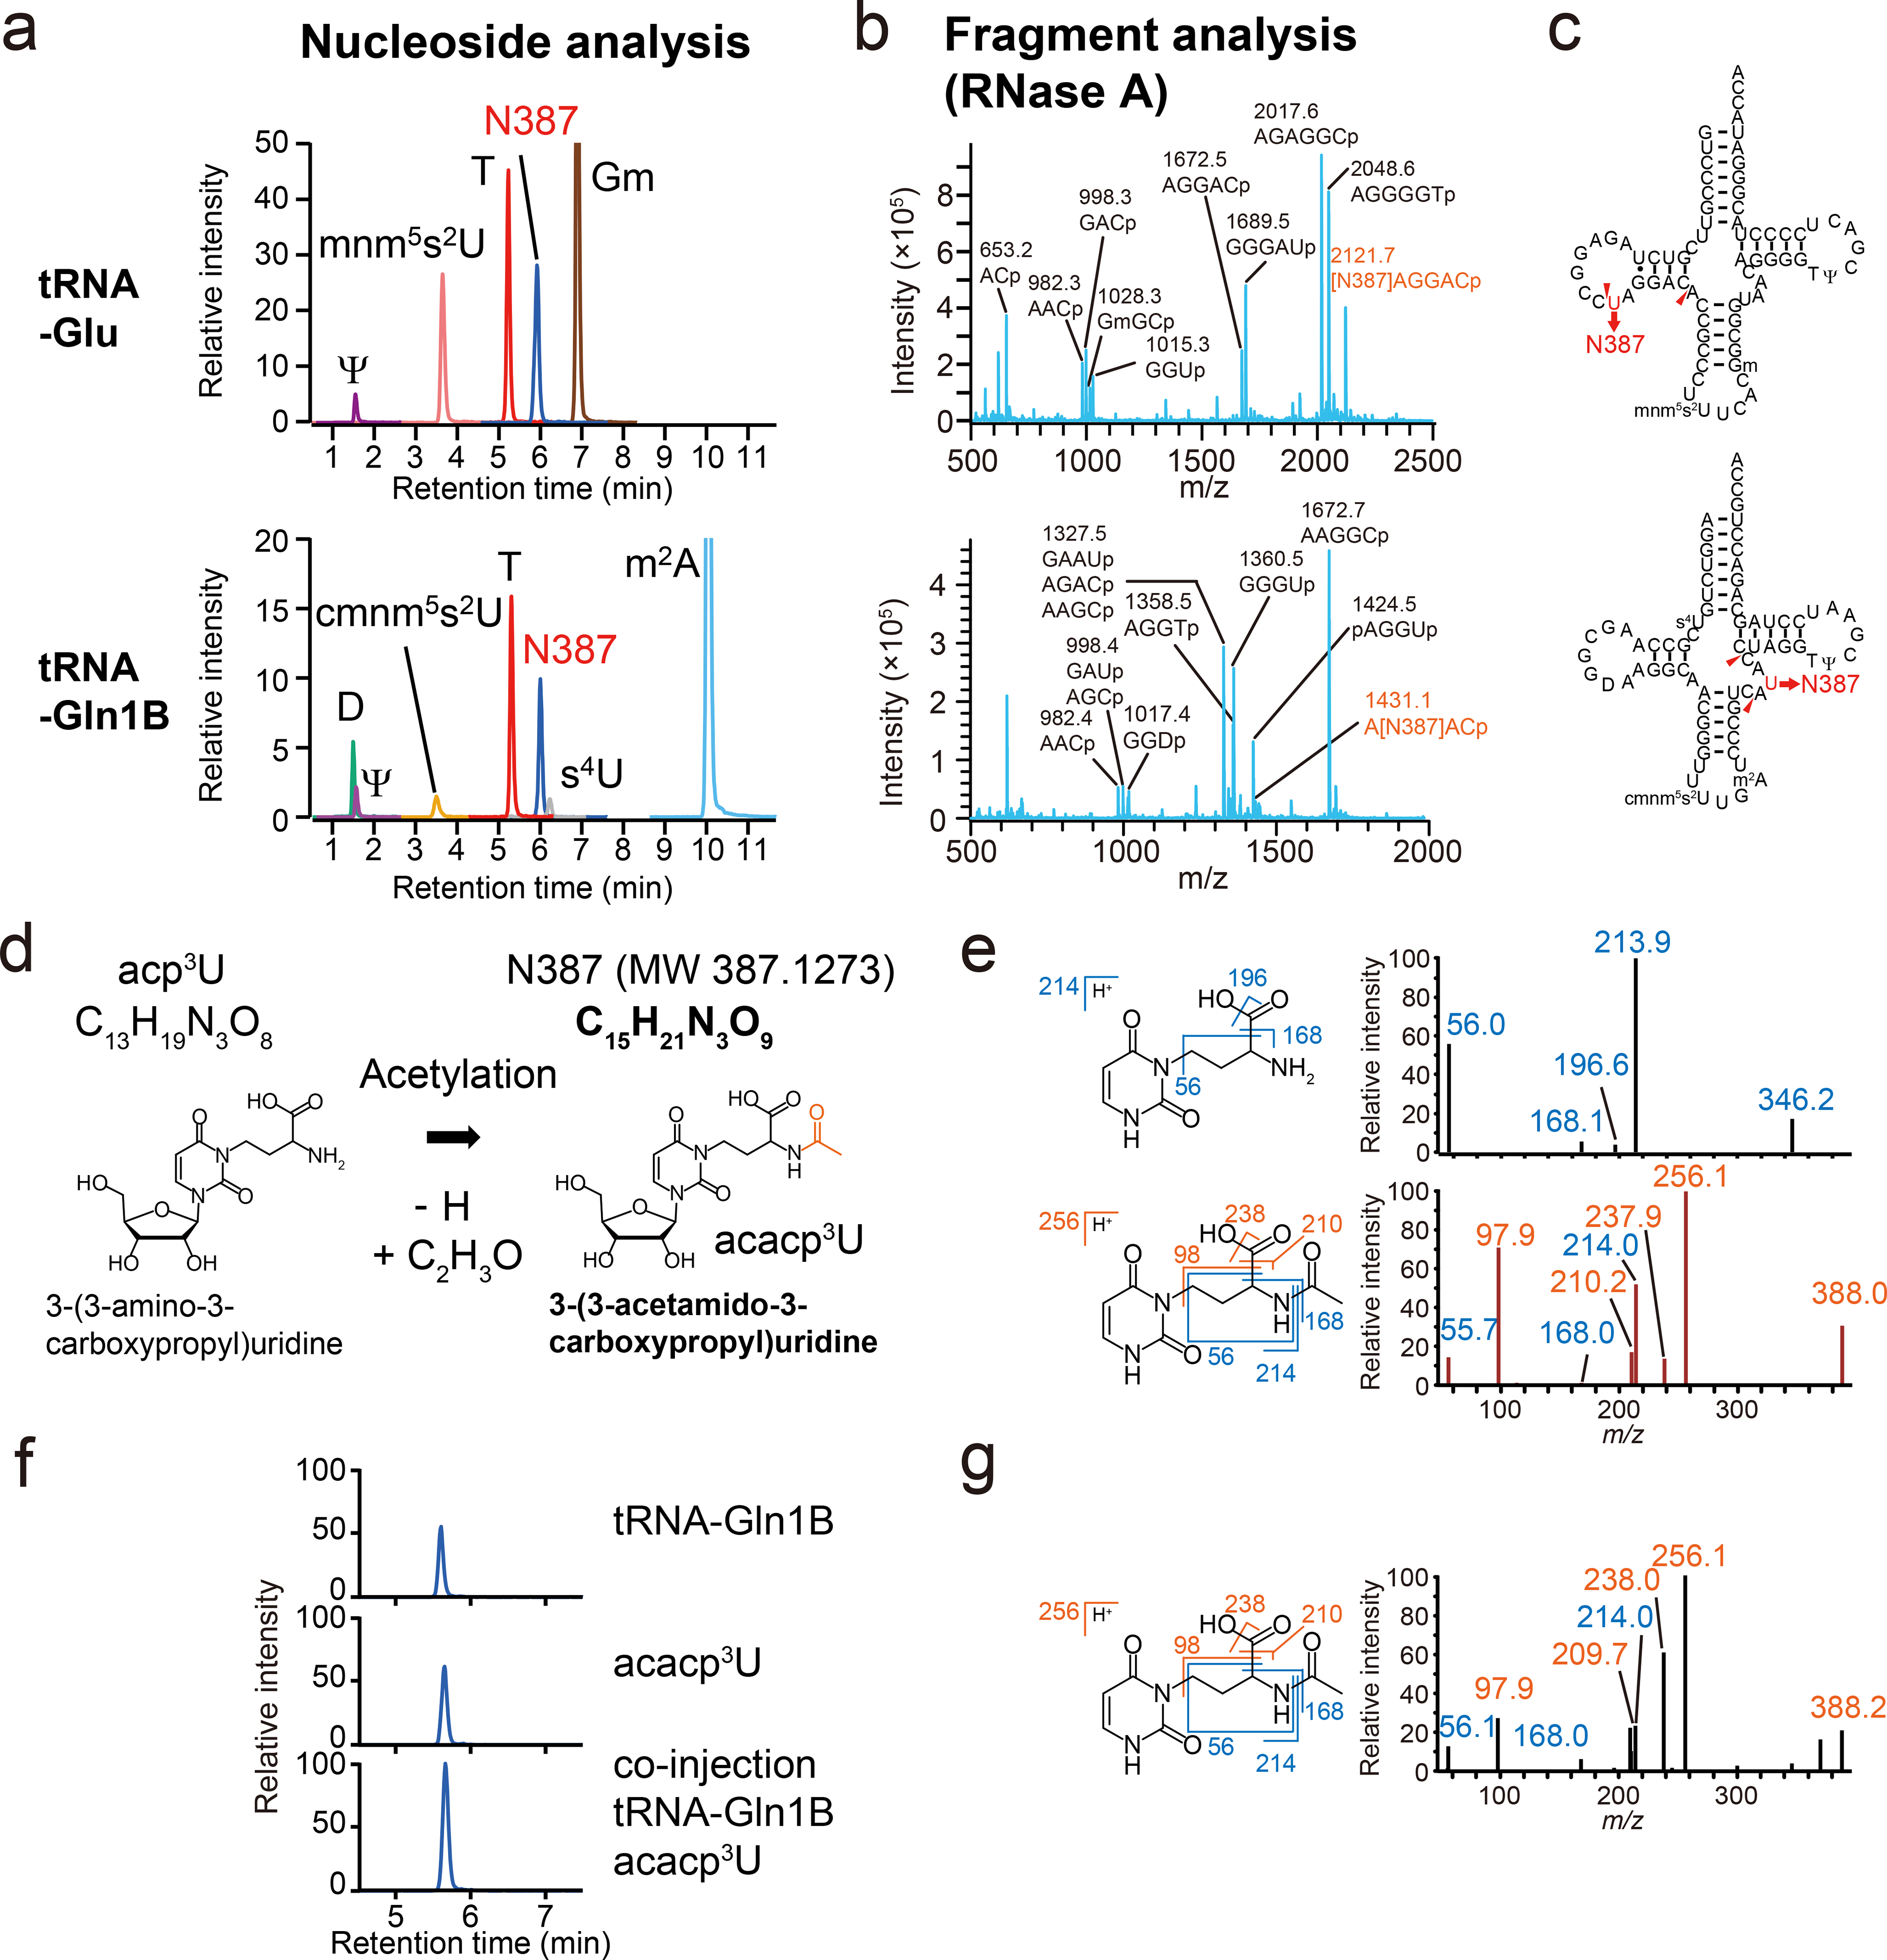
a, b, RNA mass spectrometric analyses of V. cholerae tRNA-Glu (Upper) and tRNA-Gln1B (Lower). Representative data from two independent experiments with similar results is shown.
a, nucleoside analyses by multiple reaction monitoring (MRM), showing the presence of a nucleoside whose mass is 387 (N387), found in neutral loss scans, along with known modifications (denoted in black). The peak heights between different nucleosides are not comparable.
b, Fragment analyses of RNase A digests. The fragments containing N387 are colored in red.
c, The secondary structures of tRNA-Glu (Top) and tRNA-Gln1B (Bottom) containing modifications based on nucleoside and fragment analyses.
d, Schematic of potential derivation of acacp3U (N387) from acp3U.
e, MS/MS analyses of acp3U (upper panels) and N387 (lower panels). Left panels show the structures and fragmentation patterns of the acp3U and acacp3U base components. Right panels show the product ion spectra of acp3U in tRNA-Met1 (precursor ion; m/z 346) and N387 in tRNA-Glu (precursor ion; m/z 388). Fragment ions observed in acp3U are colored in blue and N387 specific fragment ions are colored in red. Representative spectra from at least two independent MS/MS scans with similar results are shown.
f, LC/MS analysis of nucleosides of tRNA-Gln1B and chemically synthesized acacp3U. The panels show N387 derived from 20 ng tRNA-Gln1B (Top), 1.2 pmol chemical synthesized acacp3U (Middle), and a co-injected sample (Bottom). Representative data of two independent experiments with similar results in tRNA-Gln1B and acacp3U and one experiment in co-injection is shown.
g, MS/MS analysis of chemically synthesized acacp3U (precursor ion; m/z 388). Fragment ions observed in acp3U are colored in blue and acacp3U specific fragment ions are colored in red. Representative data from at least three independent MS/MS scans with similar results are shown.