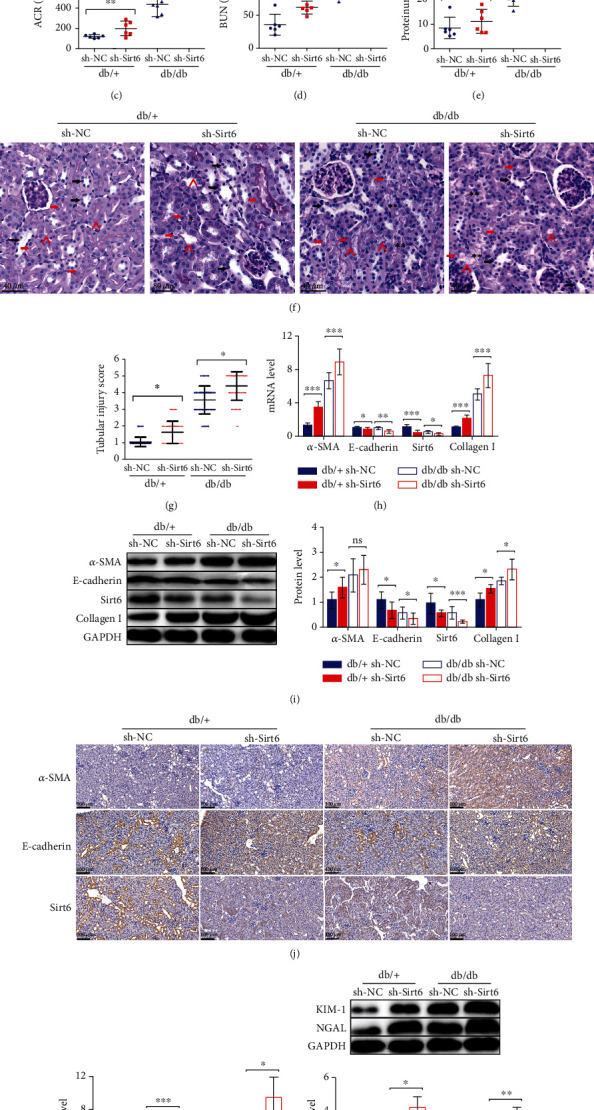
Figure 2.

Reduced Sirt6 levels contribute to the exacerbation of kidney injury in db/db mice. (a, b) Protein and mRNA were extracted from the kidneys of 20-week-old db/db and db/+ mice. (a) Sirt6 mRNA expression analyzed by qPCR. (b) Sirt6 protein expression assessed by western blot analysis. (c–j) The db/db or db/+ mice used in all experiments were 20 weeks old and were infected with sh-NC or sh-Sirt6 lentiviruses in the kidneys at 18 weeks old to knock down Sirt6 expression in vivo. (c–e) Graphs showing ACR, BUN, and proteinuria as analyzed by the ELISA kit. (f) Representative images of PAS staining of kidneys from mice. Scale bar, 40 μm. (g) Scoring of tubular injury. Proximal and distal tubules are marked with red and black arrows, respectively. “^” represents the brush border of proximal tubules. “∗” represents the cellular debris in the lumen of proximal tubules. “∗∗” represents the disorder proximal tubular structure, respectively. (h) α-SMA, E-cadherin, Sirt6, and Collagen I mRNA expression analyzed by qPCR. (i) Protein expression of α-SMA, E-cadherin, Sirt6, and Collagen I assessed by western blot analysis. (j) IHC analysis of α-SMA, E-cadherin, and Sirt6 expression in kidney tissue. (k) KIM-1 and NGAL mRNA expression analyzed by qPCR. (l) Protein expression of KIM-1 and NGAL assessed by western blot analysis. The data are presented as the means ± SD. n = 6 experiments in (a–e) and (h–l). n = 60 experiments in (g). ∗p < 0.05, ∗∗p < 0.01, and ∗∗∗p < 0.01.
