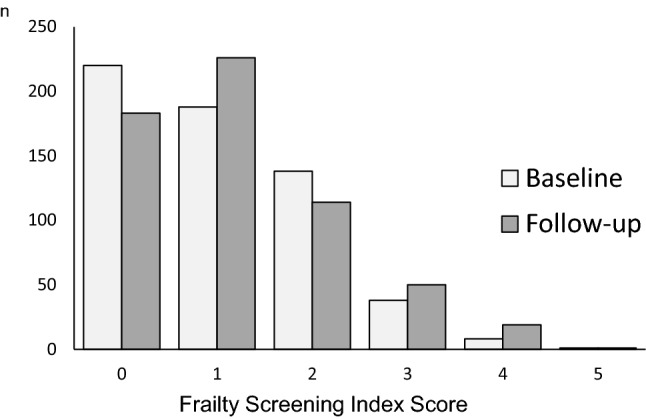
Fig. 2.

The frailty screening index score are displayed between the baseline and follow-up over six months. The mode was 0.0 and 1.0 for the baseline and follow-up, respectively. There was a significant difference in the FSI score between the baseline and follow-up (Z = 2.972, p = 0.003)
