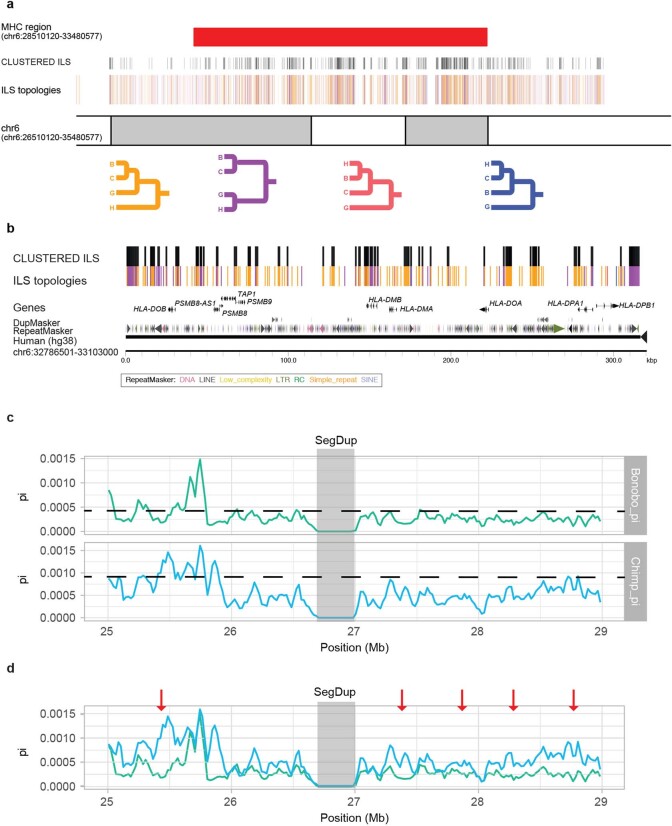
Extended Data Fig. 8. Ideogram of the MHC region with ILS annotations.
a, The four main ILS topologies are colour-coded. The four colour lines representing ILS segments are shown above the chromosome coordinate (GRCh38). The clustered ILS segments are shown above the four colour lines (black). The MHC region (red bar) corresponds to genomic coordinates on chromosome 6: 28510120–33480577. b, A magnified view of the MHC region (chromosome 6: 32786501–33103000) depicting clustered ILS nearby HLA genes. c, Nucleotide diversity of bonobo (green) and chimpanzee (blue) is shown based on human genomic coordinates (GRCh38, chromosome 6: 25000000–29000000). The mean (dashed line) is shown for bonobo (mean = 4.45 × 10⁻⁴) and chimpanzee (mean = 9.35 × 10⁻⁴). A region of reduced diversity (grey) is shown that corresponds to a segmental duplication in which single-nucleotide polymorphisms were excluded due to potential mismapping. d, Same as c but merged onto the same scale and highlighting five regions (red arrows) in which diversity is reduced in bonobo compared to chimpanzee. Three of these correspond to previously identified regions1; however, they are not among the top 1% of genome candidates showing positive selection by Tajima’s D and SweepFinder215. The overall diversity of single-nucleotide polymorphisms is reduced across the region in bonobo compared to chimpanzee.

