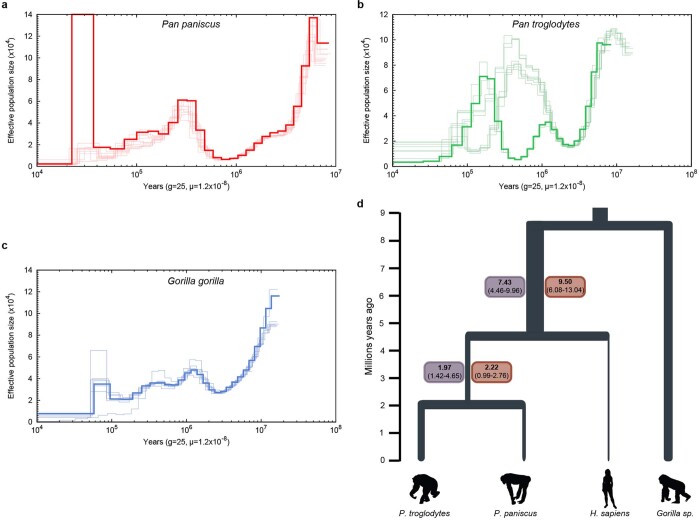
Extended Data Fig. 2. Pairwise sequentially Markovian coalescent analysis and estimates of the effective population size predating the divergence in Homo and Pan.
a–c, Pairwise sequentially Markovian coalescent (PSMC) plots based on an analysis of Illumina WGS genomes of 10 bonobos (a; red), 10 chimpanzees (b; green) and 7 gorillas (c; blue). The y axis represents the effective population size (Ne) (×104) inferred by the PSMC and the x axis represents the time in years. Ne values and time are scaled with generation time g = 25 years and a mutation rate of μ = 1.2 × 10⁻⁸ per bp per generation16. d, Values in boxes refer to median and 95% confidence interval Ne (×104) values inferred through PSMC analysis considering bonobo (red boxes) and chimpanzee (purple). We extracted size estimates from time intervals between 4 and 7 million years ago for the Homo, Pan Ne and been 1 and 2.5 million years ago for the P. paniscus, P. troglodytes Ne, considering μ = 0.5 × 10⁻⁹ mutations (bp × year) and a generation time of 25 years. Values using μ = 1 × 10⁻⁹ mutations (bp × year) are reported in Supplementary Data.

