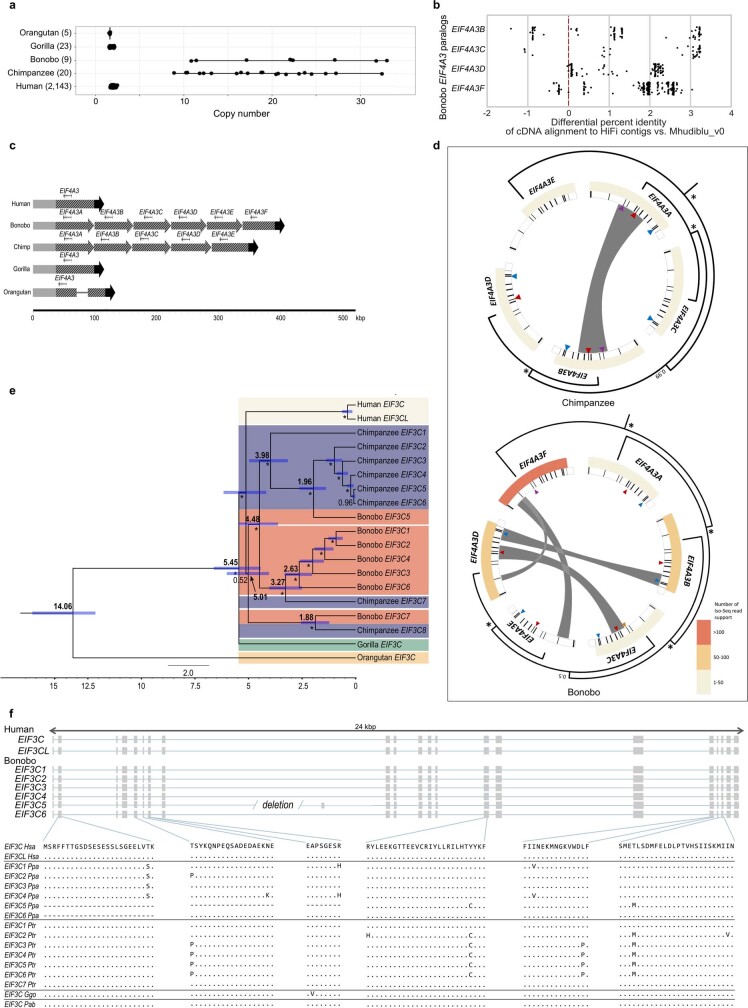
Extended Data Fig. 5. EIF4A3 and EIF3C gene family expansion and sequence resolution.
a, A comparison of EIF4A3 copy number among great apes based on a sequence-read-depth analysis confirms a variable copy number expansion in the bonobo and chimpanzee lineages (9–33 diploid copies). This recent duplication was not fully resolved initially in the bonobo reference genome (Mhudiblu_PPA_v0) because high-identity duplicated sequences were collapsed. b, Bonobo Iso-Seq full-length transcript reads map with higher identity to four of the paralogues compared to Mhudiblu_PPA_v0. c, Contigs that encompass EIF4A3 expansions and 100 kb of the flanking regions were assembled using bonobo and chimpanzee PacBio HiFi data. The 12-kb genomic sequence of human EIF4A3 mapped onto the assembled contigs. Six tandem copies of EIF4A3 spanning 310 kb in bonobo and five tandem copies spanning 262 kb in chimpanzee are recovered. Schematics show structural differences in EIF4A3 in primate genomes. Grey, black and striped arrows show different alignment blocks across the samples. A solid line connecting alignment blocks indicates an insertion event. d, Paralogues are expressed and show evidence of gene conversion in both bonobo and chimpanzee lineages. Analysis of bonobo Iso-Seq data confirms that five of the six EIF4A3 copies are expressed and maintain an open-reading frame (heat map indicates the number of Iso-Seq transcripts supporting each copy; minimap2 -ax splice -G 3000 -f 1000 --sam-hit-only --secondary=no --eqx -K 100M -t 20 --cs -2 | samtools view -F 260). GENECONV software shows significant signals (P ≤ 0.05 after multiple-test correction) of gene conversion for 16 out of 67 kb of the paralogous locus (grey bars) using multiple sequence alignment was performed using MAFFT version 7.453 (command: mafft -adjustdirection [input.fasta] > [output.msa_fasta]; GENECONV version 1.81a)). A subset of gene conversion events overlap with sites of amino acids that are specific to the Pan lineage. Triangles indicate the sites of amino acid change in each of the primate genomes compared to GRCh38. Different colours mark different changes: purple marks phenylalanine to leucine; yellow marks arginine to cysteine; red marks serine to arginine; teal marks tyrosine to serine. Same phylogenetic tree from Fig. 2 is reshaped to show the inferred evolutionary relationships among the paralogues. Nodes with >99% Bayesian posterior probabilities are indicated by asterisks; otherwise the actual number is shown. e, A phylogenetic tree was constructed from 16-kb noncoding EIF3C paralogues using Bayesian phylogenetic inference. This analysis was conducted using BEAST2 software. Numbers in bold on each major node denote estimated divergence time. The other numbers (not bold) indicate posterior probabilities. The blue error bar on each node indicates the 95% confidence interval of the age estimation. Bootstrap supports are reported using asterisks for nodes with posterior probability >99%. f, Gene models for transcribed loci based on Iso-Seq data (top). Human EIF3C and EIF3CL are compared to predicted open-reading frames for bonobo paralogues and Liftoff gene predictions for chimpanzee, orangutan and gorilla paralogues from contigs assembled from HiFi reads (bottom).

