
Fig. 2. Grain Ca, Fe, Se and Zn concentrations of crop species in Ethiopia and Malawi.
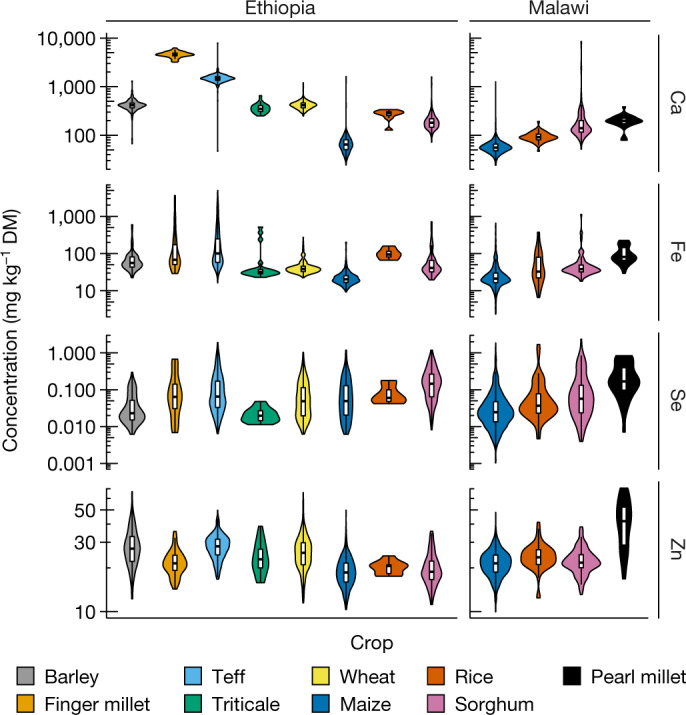
Boxes within the violins show the interquartile range, medians are marked as horizontal lines; whiskers indicate the minimum and maximum values. DM, dry matter.
Official websites use .gov
A
.gov website belongs to an official
government organization in the United States.
Secure .gov websites use HTTPS
A lock (
) or https:// means you've safely
connected to the .gov website. Share sensitive
information only on official, secure websites.
Boxes within the violins show the interquartile range, medians are marked as horizontal lines; whiskers indicate the minimum and maximum values. DM, dry matter.