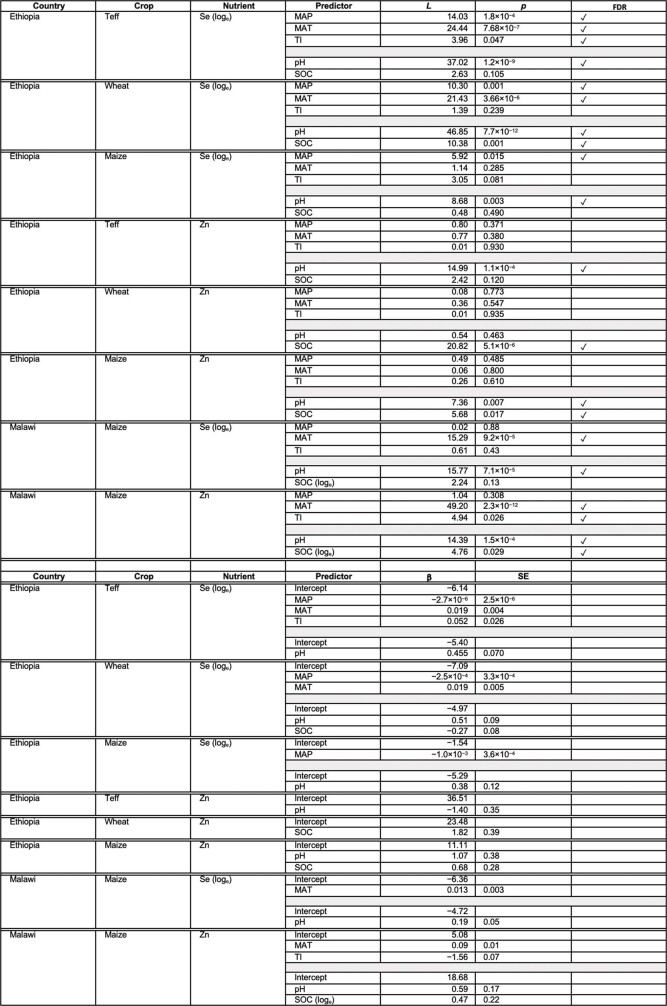
Extended Data Table 3.
Predicting grain micronutrient concentrations based on environmental covariates and soil properties
Top, significance tests for model parameters. MAP, mean annual precipitation (downscaled); MAT, mean annual temperature (downscaled); pH, soil pH measured in water; SOC, soil organic carbon percentage by mass; TI, topographic index. L is the log-likelihood ratio statistic for the null hypothesis that the named predictor is unrelated to the target variable and p is the corresponding P value. FDR indicates whether the predictor is retained (as indicated by a check mark) with control of the FDR at 0.05. Bottom, estimated coefficients (β) and their standard errors (SE) for selected predictors for grain micronutrient concentrations.

