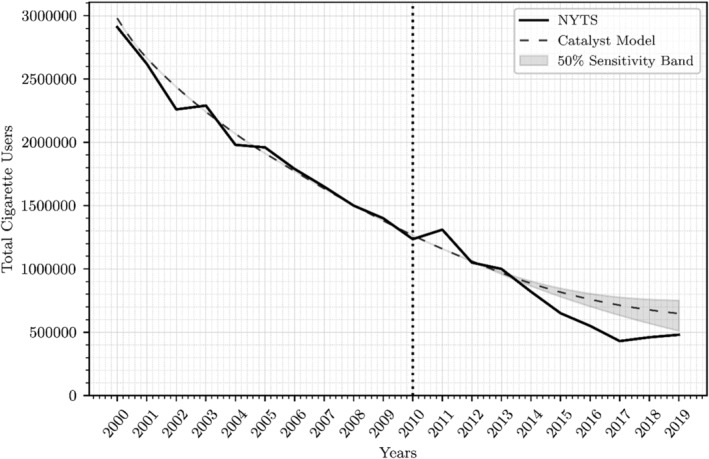
Figure 7.

Total cigarette use (exclusive cigarette use and dual use) trends under the calibrated catalyst effect. The catalyst effect was optimized to achieve the best fit between simulated and actual data in dual use, under the extremely conservative assumption that all dual use is accounted for by the catalyst effect (exponential decay constant of 19.6%/year). Here, the diversion effect is shown against historical data using National Youth Tobacco Survey (NYTS). Electronic cigarettes (ECs)are estimated to have appeared in 2010 (vertical line). The band represents the range covered in the sensitivity analysis (i.e. a 50% change in either direction of the diversion effect parameter). ECs are estimated to have appeared in 2010 (dotted vertical line)
