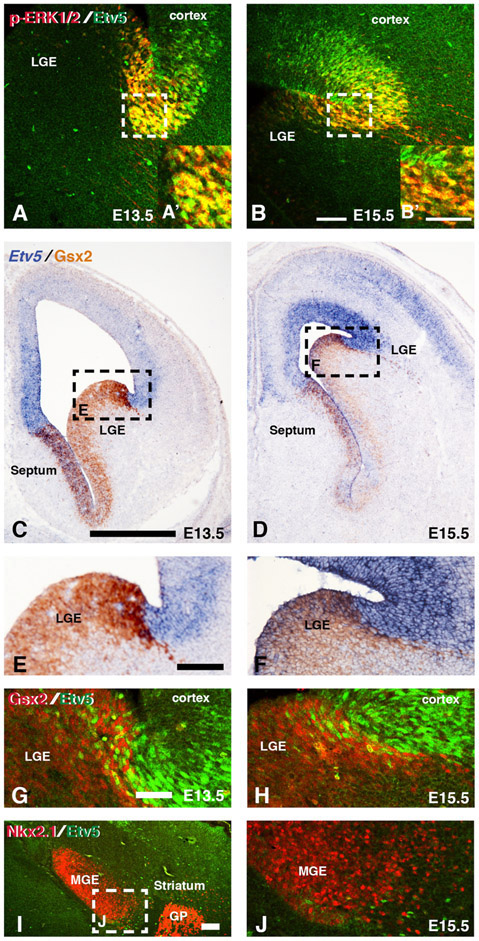
Figure 2: Etv5 expression in dorsal and ventral regions of the ventral telencephalon.
Representative confocal images from double immunofluorescence of p-ERK1/2 and Etv5 in dLGE region at E13.5 (A,A’) and E15.5 (B,B’). Dashed boxes in A and B refer to high magnification pictures in A’ and B’ respectively. Representative images from double In situ hybridization for Etv5 and immunohistochemistry for Gsx2 show overlap in the dorsal most LGE region (C-F). Dashed boxes in C and D refer to high magnification pictures in E and F respectively. Double immunofluorescence for Gsx2 and Etv5 show double positive cells at the pallio-subpallial boundary at both E13.5 (G) and E15.5 (H). Double immunofluorescence for the MGE marker Nkx2.1 and Etv5 reveals a small number of Etv5 positive cells in the ventral most MGE region at E15.5 (I-J). Dash box in I refers to high magnification image in J. Scale bars in B= 100μM for images A-B, B’= 50μM for images A’,B’, C= 500μM for images in C-D, E= 100μM for images in E-F, G= 50μM for images in G-H and J, I=100μM for image in I. LGE=lateral ganglionic eminence, MGE= medial ganglionic eminence, GP= globus pallidus

