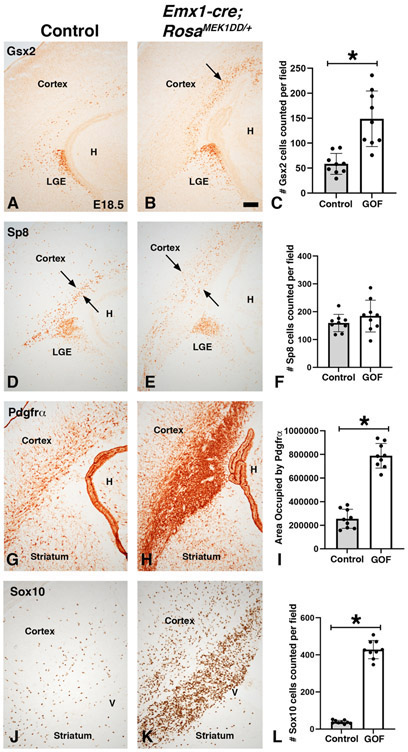
Figure 8: Sustained MEK/MAPK activity in the cortex results in the expression of dLGE and OPC genes at late embryonic stages.
Representative images at E18.5 from controls (A, D, G, and J) and MEK/MAPK GOF double transgenic Emx1-Cre;RosaMEK1DD/+ (B, E, H, and K) embryos. Increased numbers of Gsx2+ cells were observed in the cortex near the ventricular zone of cortical MEK/MAPK GOF embryos (arrows in B) compared to control embryos that only show sparse Gsx2+ cells in the cortex (A). Sp8 positive cells are observed near the cortical VZ of controls (D). Cortical MEK/MAPK GOF embryos show a disorganized pattern of Sp8 cells (compare arrows in E to D). The OPC markers Pdgfrα and Sox10 were robustly increased in MEK/MAPK GOF embryos in the cortical VZ and into the cortical mantle zone (compare H,K to G,J). Gsx2 (C), Sp8 (F), and Sox10 (L) were quantified cells per field. Pdgfrα (I) was quantified as area (pixels) occupied by stain. Asterisk in C, I, and L= p<.001, significance determined by Students t-test. Graph in F showed no significant change in Sp8 cell number (p=0.2659, determined by Students t-test). Scale bars in: B= 200μM for images in A-F.

