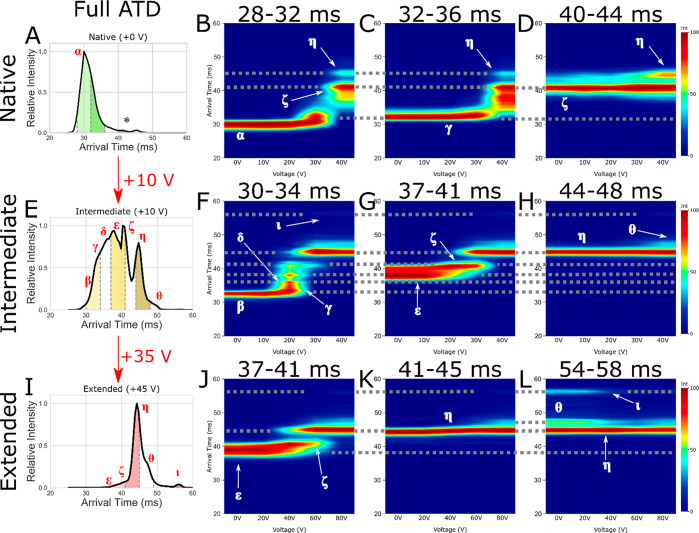
Figure 3.
Arrival time distribution for (A) native (+0 V), (E) intermediate (+10 V), and (I) extended (an additional +35 V making +45 V total activation) CytC (+7) with subpopulation slices taken for CA denoted by dashed gray lines, filled with green (native), yellow (intermediate), and red (extended). Also shown are CA fingerprints for subpopulations of interest corresponding to native (B, F, J), intermediate (C, G, K), and extended (D, H, L) states, with interpopulation conformations joined by dotted gray lines. Identified conformations of interest are labeled as α, β, γ, δ, ε, ζ, η, θ, and ι. The * denotes the low intensity species mobility selected in plot (D).

