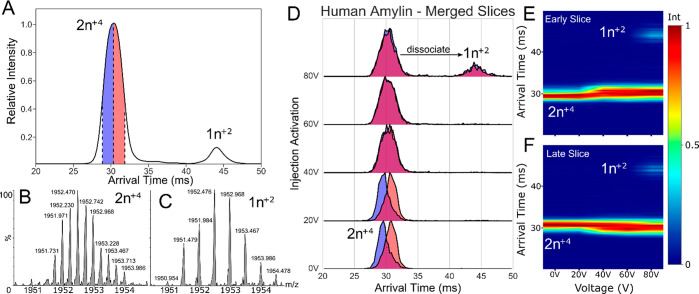
Figure 6.
Slice-CA of hIAPP: (A) ATD of 1952 m/z species showing a mix of +2 monomer (1n+2) and +4 dimer (2n+4) where n is the oligomeric state; (B) isotopic peak envelope for dimer; (C) isotopic peak envelope for monomer; (D) stacked IM plots of early slice (blue) and late slice (red); (E) CA fingerprint of early slice; (F) CA fingerprint of late slice.

