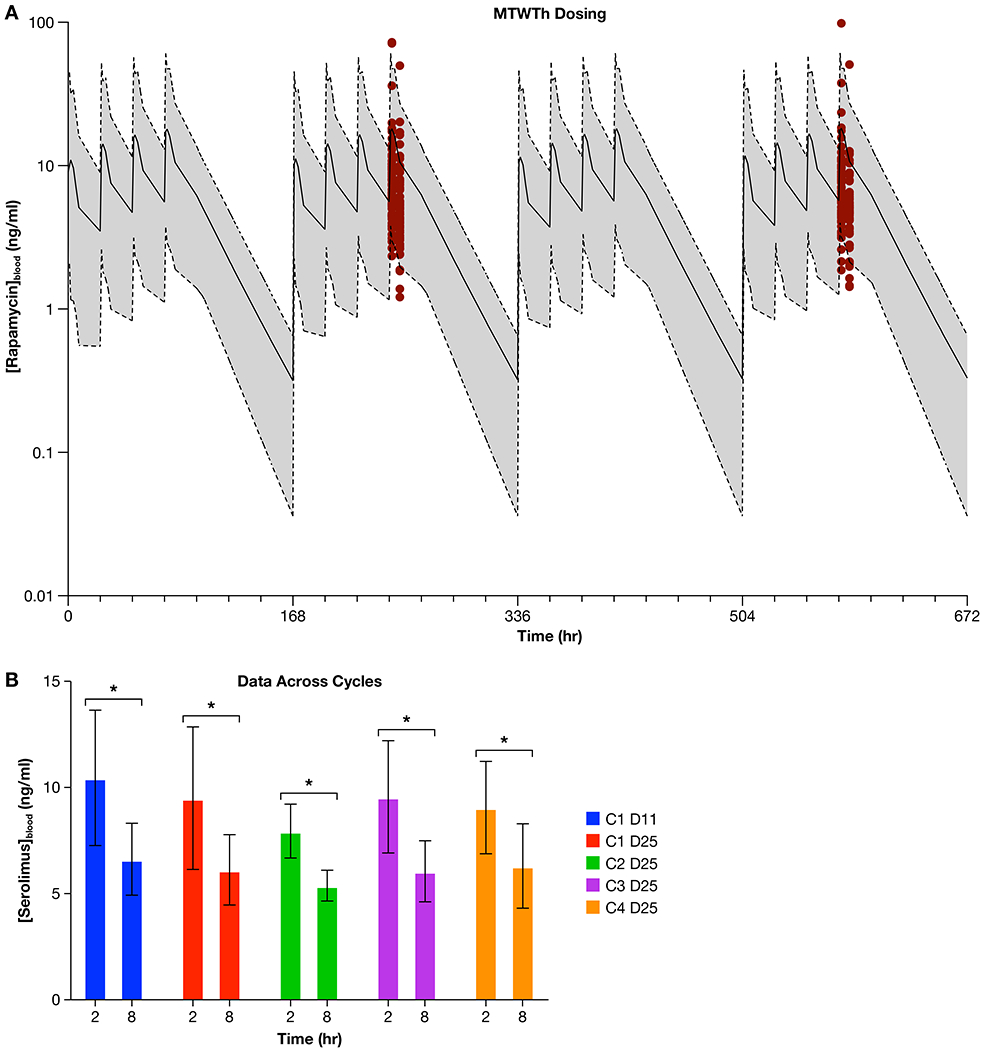
Figure 3.

(a.) Red dots depict the sirolimus blood levels that were measured in dogs receiving 0.1 mg/kg orally on a Monday through Thursday basis within the SOC + S trial. These data were generated from whole blood of dogs (n = 61) on Cycle 1 Day 11 and Cycle 1 Day 25), and are overlaid with the simulated Area under the Curve (AUC) that was predicted from a simulation of Monday through Thursday dosing of 0.1 mg/kg (solid line = simulated mean sirolimus concentration; shaded area bound by dotted lines = simulated range of sirolimus concentration). The simulated sirolimus AUC data was generated from the walk-in study of sirolimus. Figure 3b. displays sirolimus concentrations in whole blood shown as the average value and 95% CI, obtained from dogs receiving 0.1 mg/kg of sirolimus orally within the SOC + S clinical trial, at the 2- and 8-hour time points across the 4 cycles of drug treatment (C1 D11 = Cycle 1, Day 11; C1 D25 = Cycle 1 Day 25; C2 D25 = Cycle 2 Day 25; C3 D25 = Cycle 3 Day 25; C4 D25 = Cycle 4 Day 25). ANOVA analysis shows that the 2 and 8 hour time points for each cycle are significantly different (* denotes significant difference, p < 0.0001) but none of the 2 or 8 hour average values were significantly different (p = 0.4825) when compared across dosing cycles.
