Figure 4:

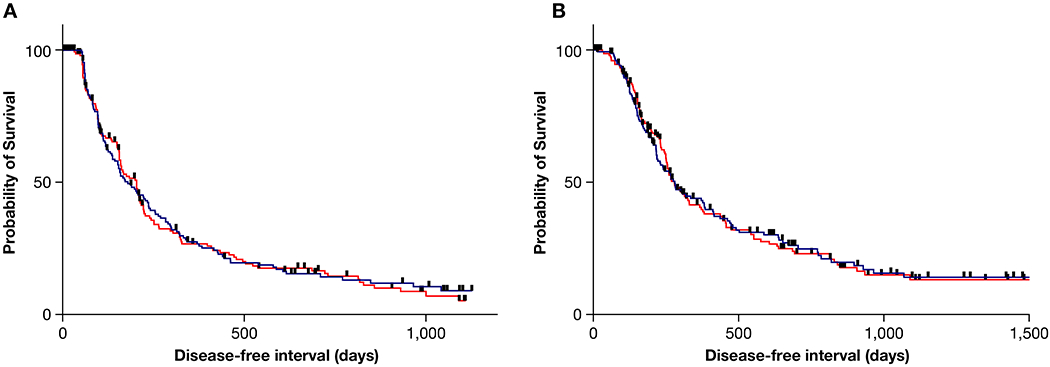
Kaplan-Meier event curves depicting the probability of survival with respect to disease-free interval (a) and overall survival (b) between the SOC (blue line) and SOC + S (red line) arms of the trial.

Kaplan-Meier event curves depicting the probability of survival with respect to disease-free interval (a) and overall survival (b) between the SOC (blue line) and SOC + S (red line) arms of the trial.