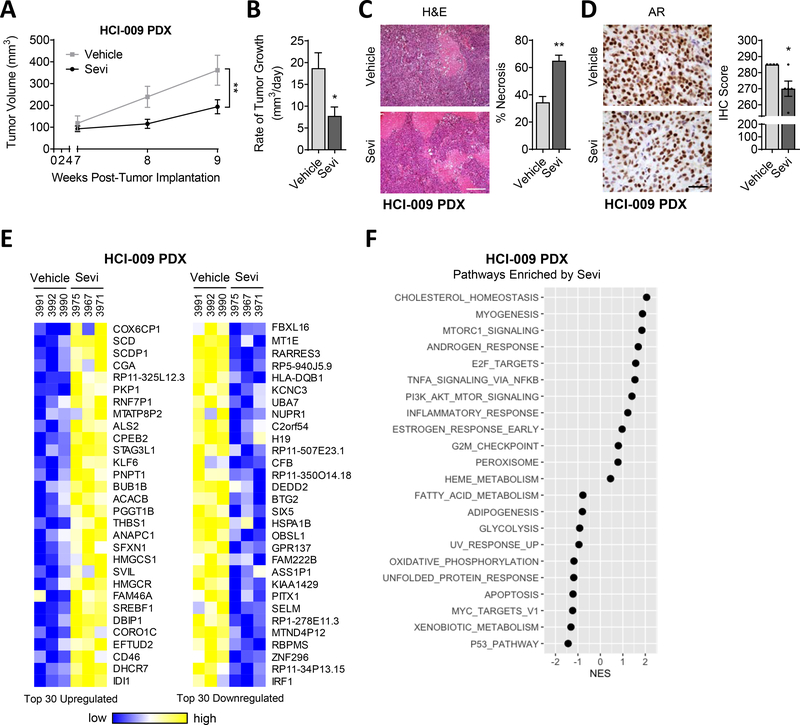
Figure 3. AR-positive TNBC PDX sensitivity to AR-targeted therapy.
HCI-009 PDX tumor portions were injected into the mammary fat pads of female NSG mice. Mice were treated daily with vehicle or 150mg/kg/day Sevi (seviteronel). (A) Tumor volume was measured with calipers and (B) the rate of tumor growth per day over two weeks was calculated. (C) The percentage of tumor necrosis and (D) AR positive cells per tumor were quantified; representative images of H&E staining, scale bars = 200μm and 50μm, respectively. (E) Shown are the top 30 up- and downregulated genes and (F) most highly correlated biological pathways identified by Gene Set Enrichment (GSEA) in RNAseq data from HCI-009 PDX tumors from mice treated with Sevi. Mean ± standard error of the mean; * p<0.05, ** p<0.01.

