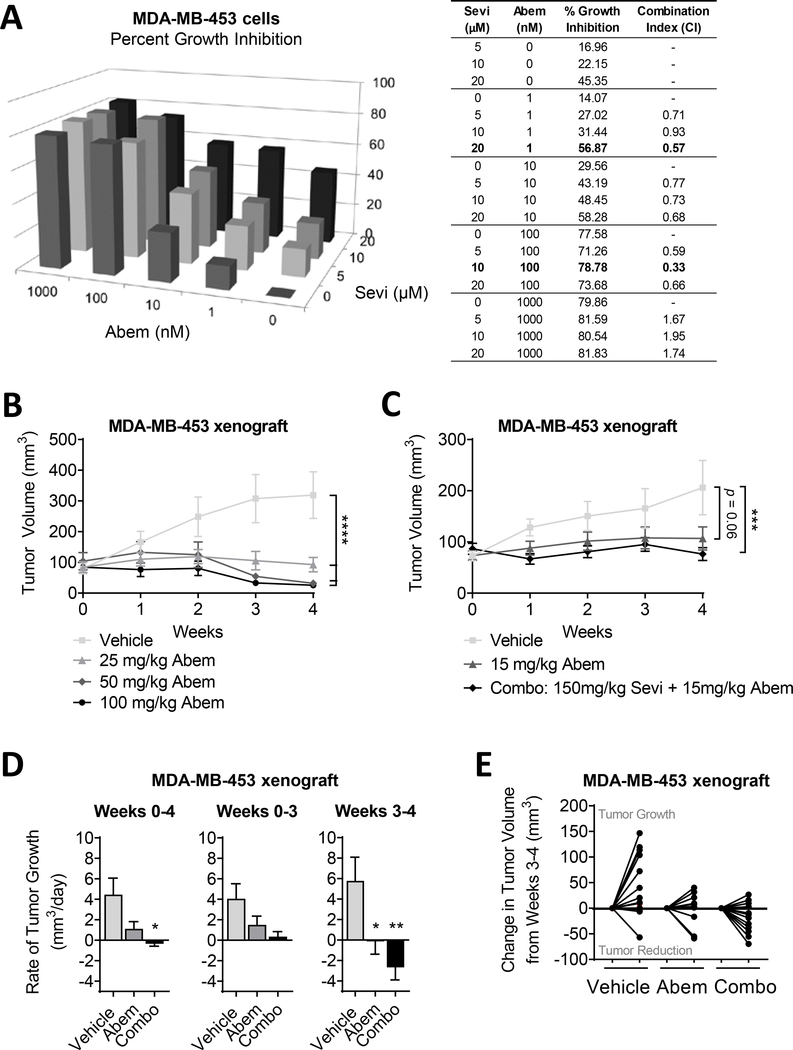
Figure 5. Combination treatment of TNBC cells with an anti-androgen and cell cycle inhibitor.
(A) MDA-MB-453 cells were cultured in full serum media. Cell viability was determined by crystal violet assay after a 5-day exposure to DMSO (0) or increasing concentrations of Sevi (seviteronel) and Abem (abemaciclib; CDK4/6 inhibitor). Data was normalized to the mean absorbance of DMSO-treated cells and presented as mean percent growth inhibition. CalcuSyn software was used to calculate the degree of synergy between combination treatments, represented as the combination index. Combination indexes < 0.9 indicate synergy. (B) MDA-MB-453 cells were bilaterally injected into the mammary fat pads of cycling female nu/nu mice. Abem was administered daily. Tumor volume was measured with calipers. (C-E) MDA-MB-453 cells were injected into the mammary fat pads of cycling female nu/nu mice. Abem and/or Sevi were administered daily. (C) Tumor volume was measured with calipers and (D) the rate of tumor growth per day over four weeks was calculated. Rate of tumor growth was broken down to illustrate the differences in tumor growth over the first 3 weeks of treatment compared to the final week alone. (E) Change in tumor volume, either growth or reduction, during the final week of treatment is depicted for each individual mouse. Mean ± standard error of the mean; * p<0.05, ** p<0.01, *** p<0.001, **** p<0.0001.

