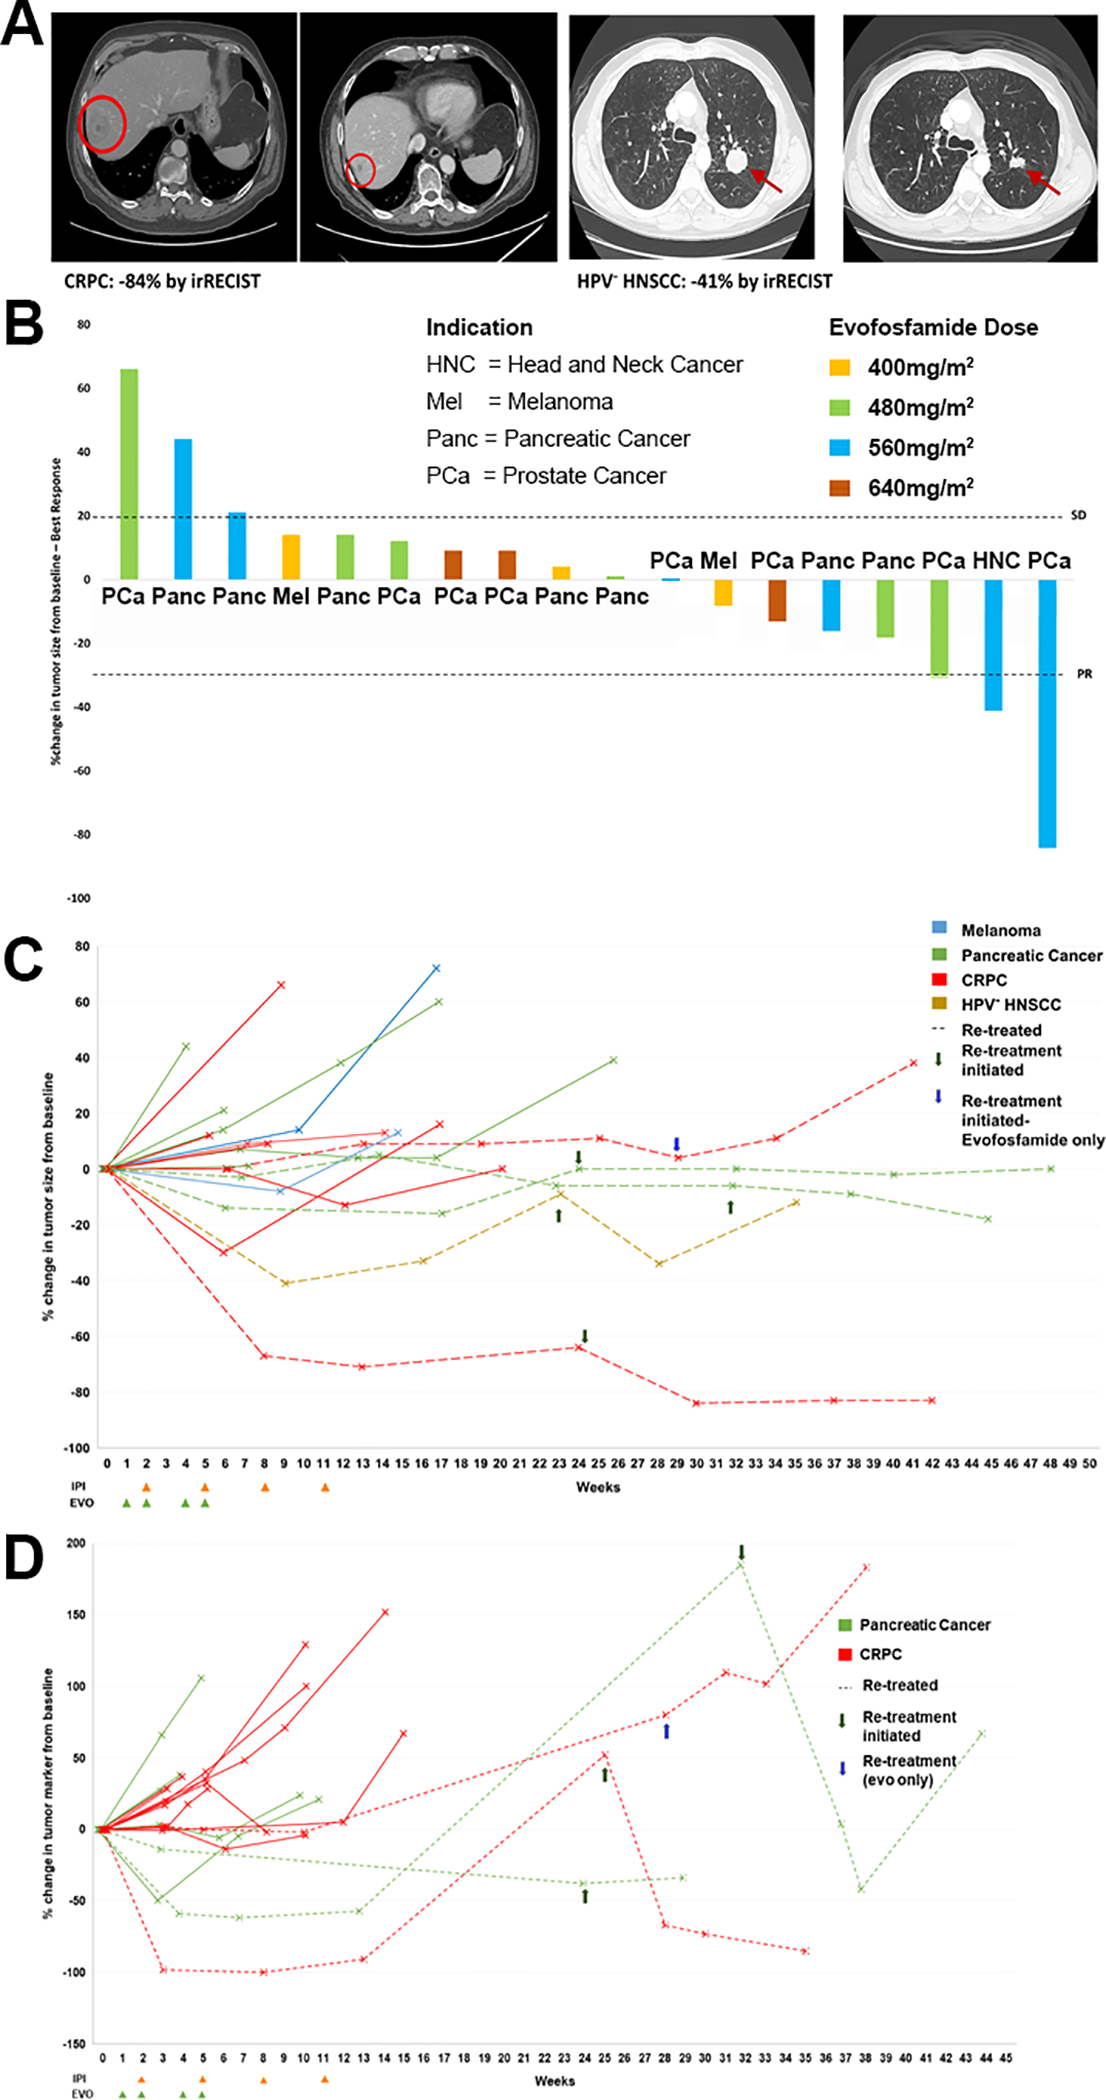
Figure 1. Responses to evofosfamide and ipilimumab combination therapy.

A) Best response scans for a prostate cancer and HPV- head and neck cancer patient who achieved partial response at 560 mg/m2 evofosfamide. B) Waterfall plot showing best percent change in tumor size across all four doses of evofosfamide (color coded) with tumors indicated on the X axis. C) Spider plot showing changes in tumor size over time for all patients with measurable lesions. D) CA 19–9 or PSA changes from baseline were tracked over time for indicated patients. Green arrows indicate retreatment with ipilimumab and evofosfamide. The blue arrow indicates re-treatment with evofosfamide only.
