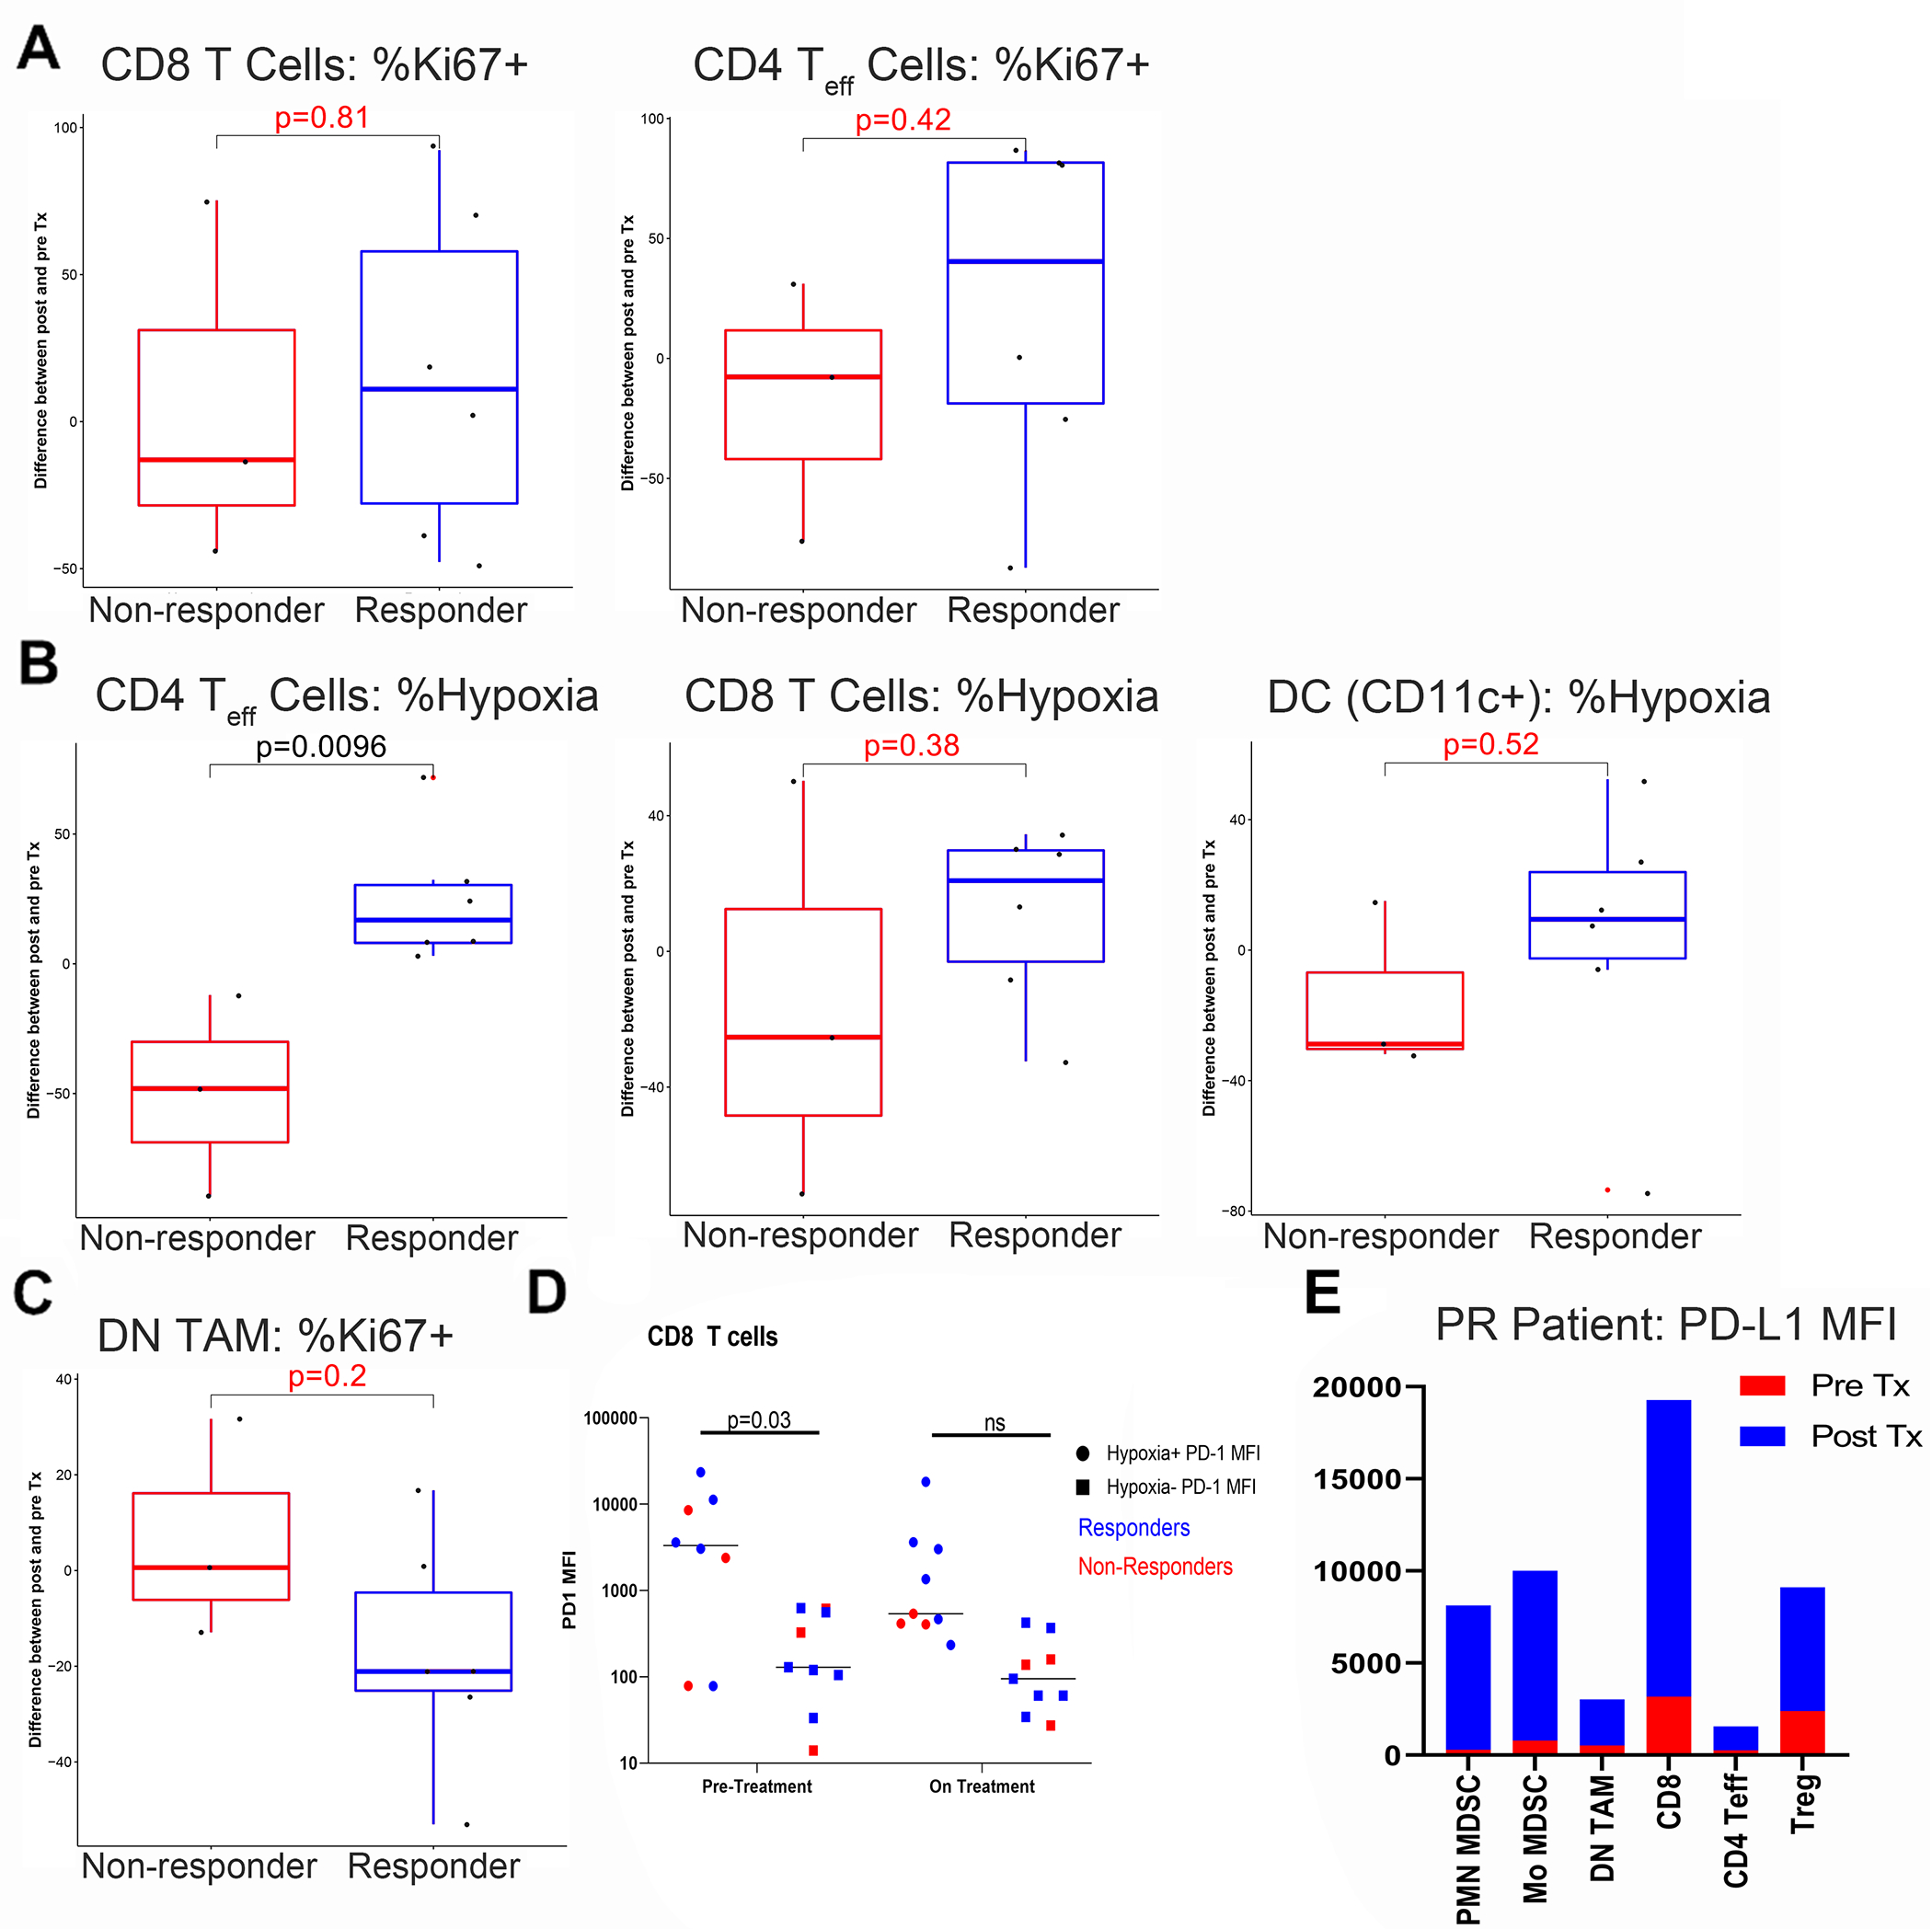
Figure 3. Evofosfamide and ipilimumab therapy increases immune activation of the tumor microenvironment in responders.

Patient biopsies were obtained at baseline and at week 7, and assessed for hypoxia and immune composition and function by 20-color flow cytometry. A) Proliferation of tumor-infiltrating CD8 and CD4 T effector cells was analyzed based on Ki-67 expression. B) Patients were given oral pimonidazole 5–24 hours prior to biopsy to evaluate tumor hypoxia using anti-pimonidazole antibody conjugated to the fluorescent dye ATT0 594 (Hypoxyprobe), and densities of T cells and dendritic cells in hypoxic areas was assessed. C) Proliferation of immune-suppressive CD33+CD14-CD15- tumor-associated macrophages was evaluated by Ki-67 expression. D) Hypoxia-exposed (pimonidazole+, circles) vs non-hypoxia resident (pimonidazole-, squares) CD8 T cells were analyzed for PD-1 expression pre- and on-treatment (cycle 3 day 8). E) PD-L1 expression was assessed in tumor-infiltrating T cells and myeloid cells in a representative responding patient. P values are indicated for Student’s t-test comparing responders and non-responders, with significant values listed in black and insignificant values listed in red or marked “ns” for the purpose of assessing trends.
