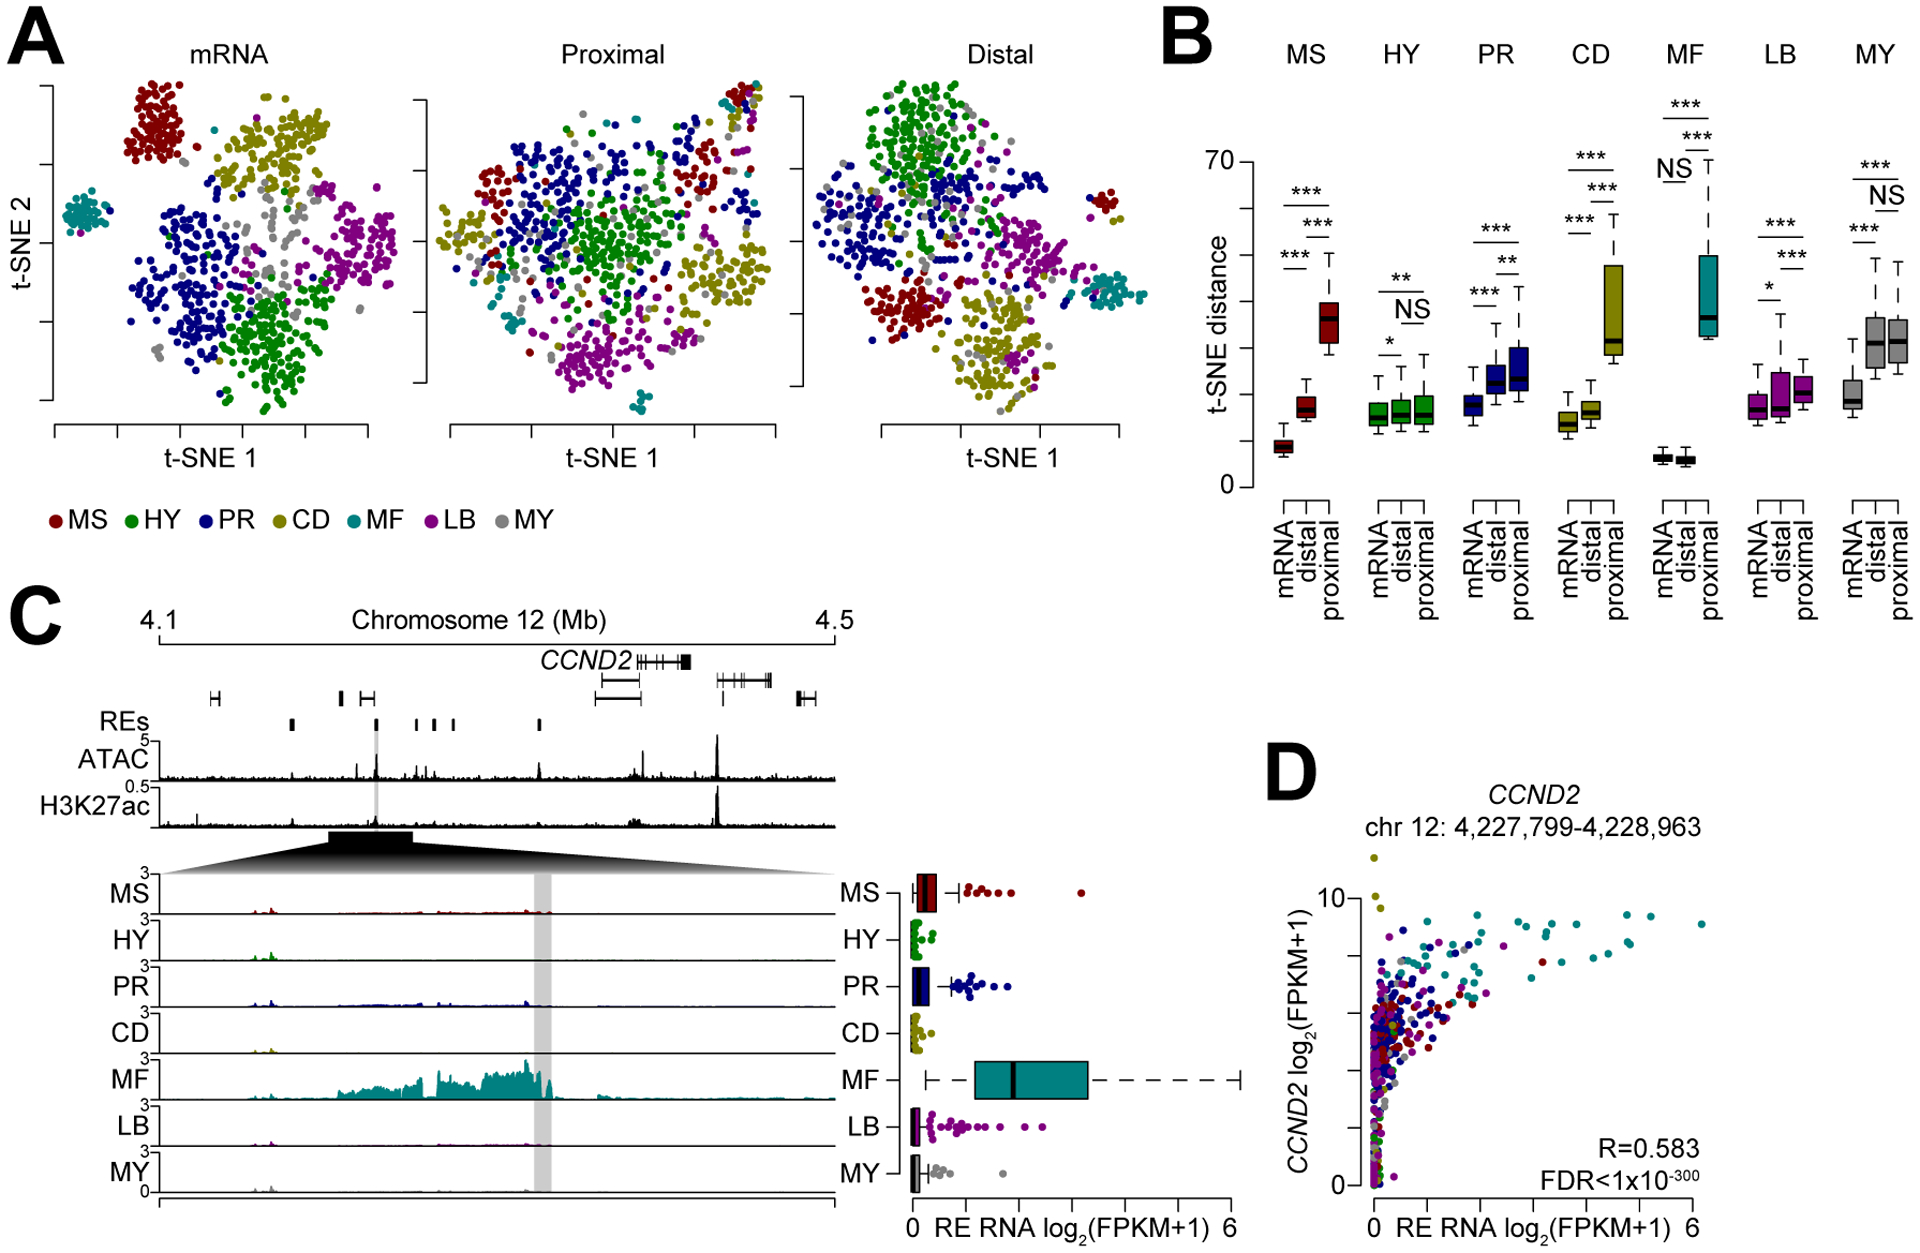
Figure 5.

Distal regulatory elements define myeloma subtype gene expression. A, t-SNE analysis of gene expression data (left), transcription at promoter proximal (middle) and distal (right) regulatory elements. Samples are colored by myeloma gene expression subtype (key bottom). B, t-SNE distance between samples within a given subtype (denoted by color) for mRNA as well as promoter proximal and distal regulatory elements. ***P<0.001, **P<0.01, *P<0.05, NS: not significant; determined by a paired Mann-Whitney U test. C, Genome plot of regions distinctly regulated between myeloma subtypes near the CCND2 locus. Regulatory elements (REs) are denoted on top with cumulative ATAC (RPPM) and H3K27ac (RPM) signal shown and mean transcription is shown (log2(RPM+1)) for each myeloma subtype. Transcription for the shaded region is shown (right). D, Scatterplot of CCND2 expression and regulatory element transcription.
