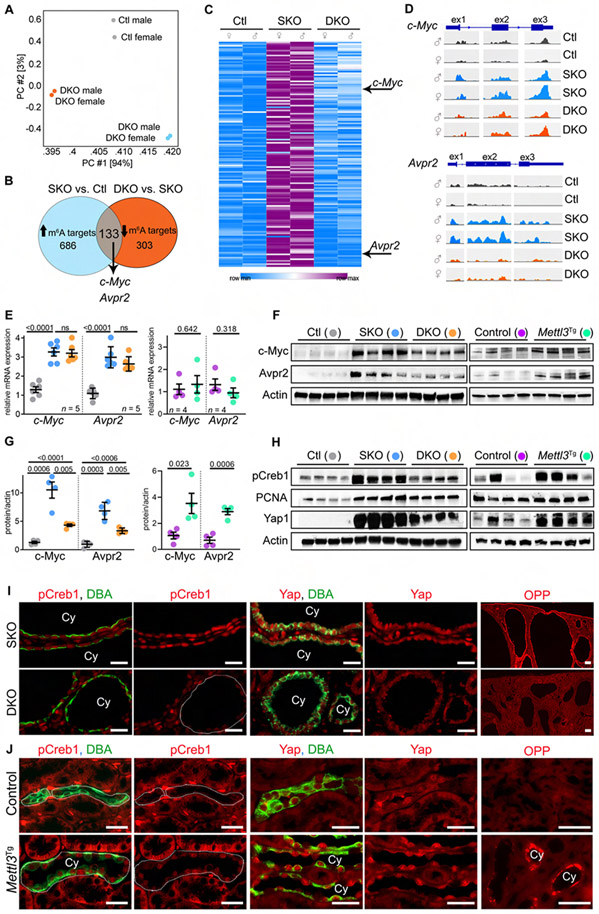
Figure 4: Mettl3 deletion inhibits c-Myc and Avpr2-cAMP signaling in cystic kidneys.
(A) Principle component analysis of MeRIP-Seq data from P18 control (Ctl), Pkd1F/RC-KO (SKO), and Pkd1F/RC-Mettl3-KO (DKO) kidneys.
(B) Comparative analysis (Ctl vs. SKO vs. DKO) used to identify Mettl3 mRNA targets in PKD.
(C) Heatmap showing m6A levels on the 133 Mettl3 mRNA targets in P18 Ctl, SKO, and DKO kidneys.
(D) IGV tracks showing m6A modification on c-Myc and Avpr2 mRNAs in Ctl, SKO, and DKO kidneys.
(E) qRT-PCR analysis showing c-Myc and Avpr2 mRNA expression in P18 Ctl (grey circles), SKO (blue circles), and DKO (orange circles) kidneys or P60 control (purple circles) and Mettl3Tg (green circles) kidneys.
(F) Immunoblot showing c-Myc and Avpr2 expression in P18 Ctl, SKO, and DKO kidneys, and P60 control and Mettl3Tg kidneys. Beta-actin acts as the loading control.
(G) Quantification of immunoblots in (F) is shown.
(H) Immunoblots showing pCreb1, PCNA, and Yap1 expression in P18 SKO and DKO kidneys, and P60 control and Mettl3Tg kidneys. Beta-actin acts as the loading control.
(I) Representative images showing pCreb1 and Yap1 immunostaining and O-propargyl puromycin (OPP) incorporation in P18 SKO and DKO kidneys. (n = 8 images from 4 biological replicate kidneys/group).
(J) Representative images showing pCreb1 and Yap1 immunostaining and OPP incorporation in P60 control (n = 10 images from 4 biological replicate kidneys) and Mettl3Tg kidneys (n = 11 images for pCreb1, 5 images for Yap1 and 15 images for OPP from 4 biological replicate kidneys).
Scale bars: 50 um; Error bars represent SEM; Student's t-test and One-way ANOVA, Tukey's multiple-comparisons test (E, G). See also Figures S4 & S5 and Table S1.

