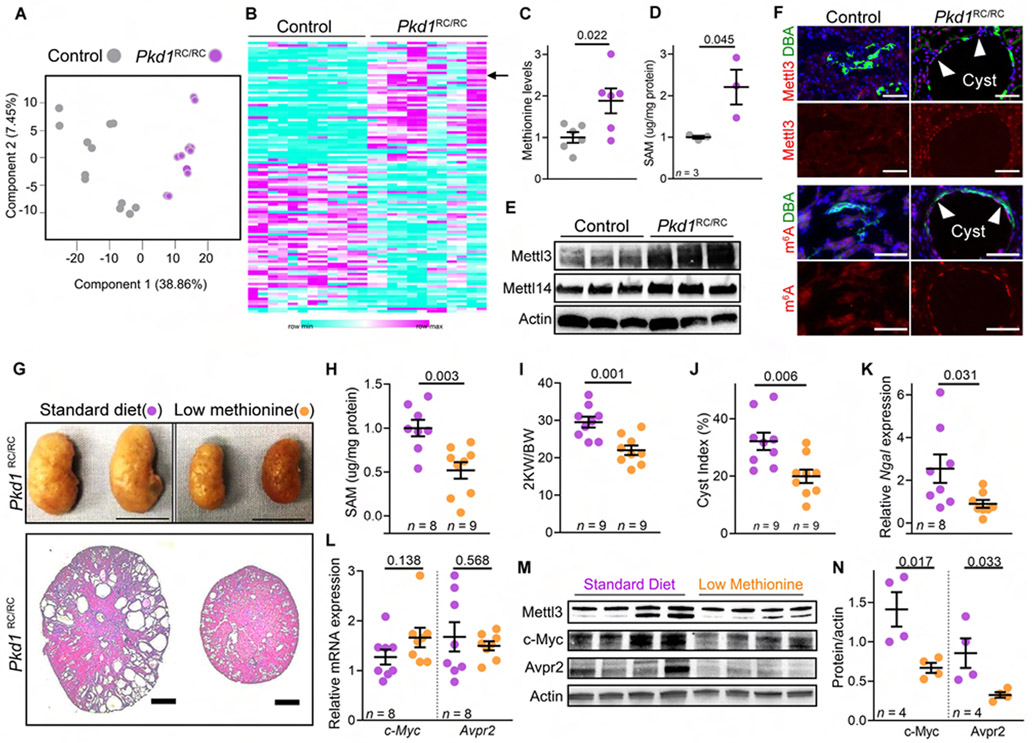
Figure 6: Low methionine diet inhibits Mettl3 expression and ameliorates in vivo cyst growth.
(A) Principle component analysis of the kidney metabolomics data of 30-week-old control and Pkd1RC/RC mice.
(B) Heatmap showing the 109 differentially present kidney metabolites in 30-week-old control and Pkd1RC/RC mice. Arrow indicates methionine.
(C) Mass spectrometry-measured kidney methionine levels in 30-week-old control mice (n = 6, grey) and Pkd1RC/RC mice (n = 6, purple).
(D) ELISA-measured SAM levels in the kidneys of 48-week-oldcontrol (n = 3, grey) and Pkd1RC/RC mice (n = 3, purple).
(E) Immunoblot showing Mettl3 and Mettl14 expression in kidneys of 48-week-old control and Pkd1RC/RC mice. Beta-actin acts as the loading control.
(F) Representative images showing Mettl3 and m6A immunostaining and DBA labeling in kidneys of 48-week-old control (n = 9 images from 4 biological replicate kidneys) and Pkd1RC/RC mice (n = 8 images from 4 biological replicate kidneys). Anti-Mettl3 or anti-m6A antibodies (red) and DBA (green).
(G) Whole kidney images and H&E-stained kidney sections from 5-month-old Pkd1RC/RC mice on standard (purple circles) or methionine-restricted (MR) diet (orange circles).
(H) ELISA-measured kidney SAM levels in 5-month-old Pkd1RC/RC mice on a standard or MR diet.
(I-K) KW/BW ratio, cyst index, and kidney Ngal mRNA expression in 5-month-old Pkd1RC/RC mice on a standard or MR diet.
(L) qRT-PCR analysis showing c-Myc and Avpr2 expression in kidneys of 5-month-old Pkd1RC/RC mice on standard or MR diet.
(M-N) Immunoblot analysis showing Mettl3, c-Myc, and Avpr2 protein expression in kidneys from 5-month-old Pkd1RC/RC mice on standard or MR diet. Beta-actin acts as the loading control.
Scale bars: (E) 100 uM (Mettl3 images) and 50 uM (m6A images), (F) 1 cm (top) and 2 mm (bottom); Error bars represent SEM; Student’s t-test (all graphs). See also Figure S6 & Table S2.

