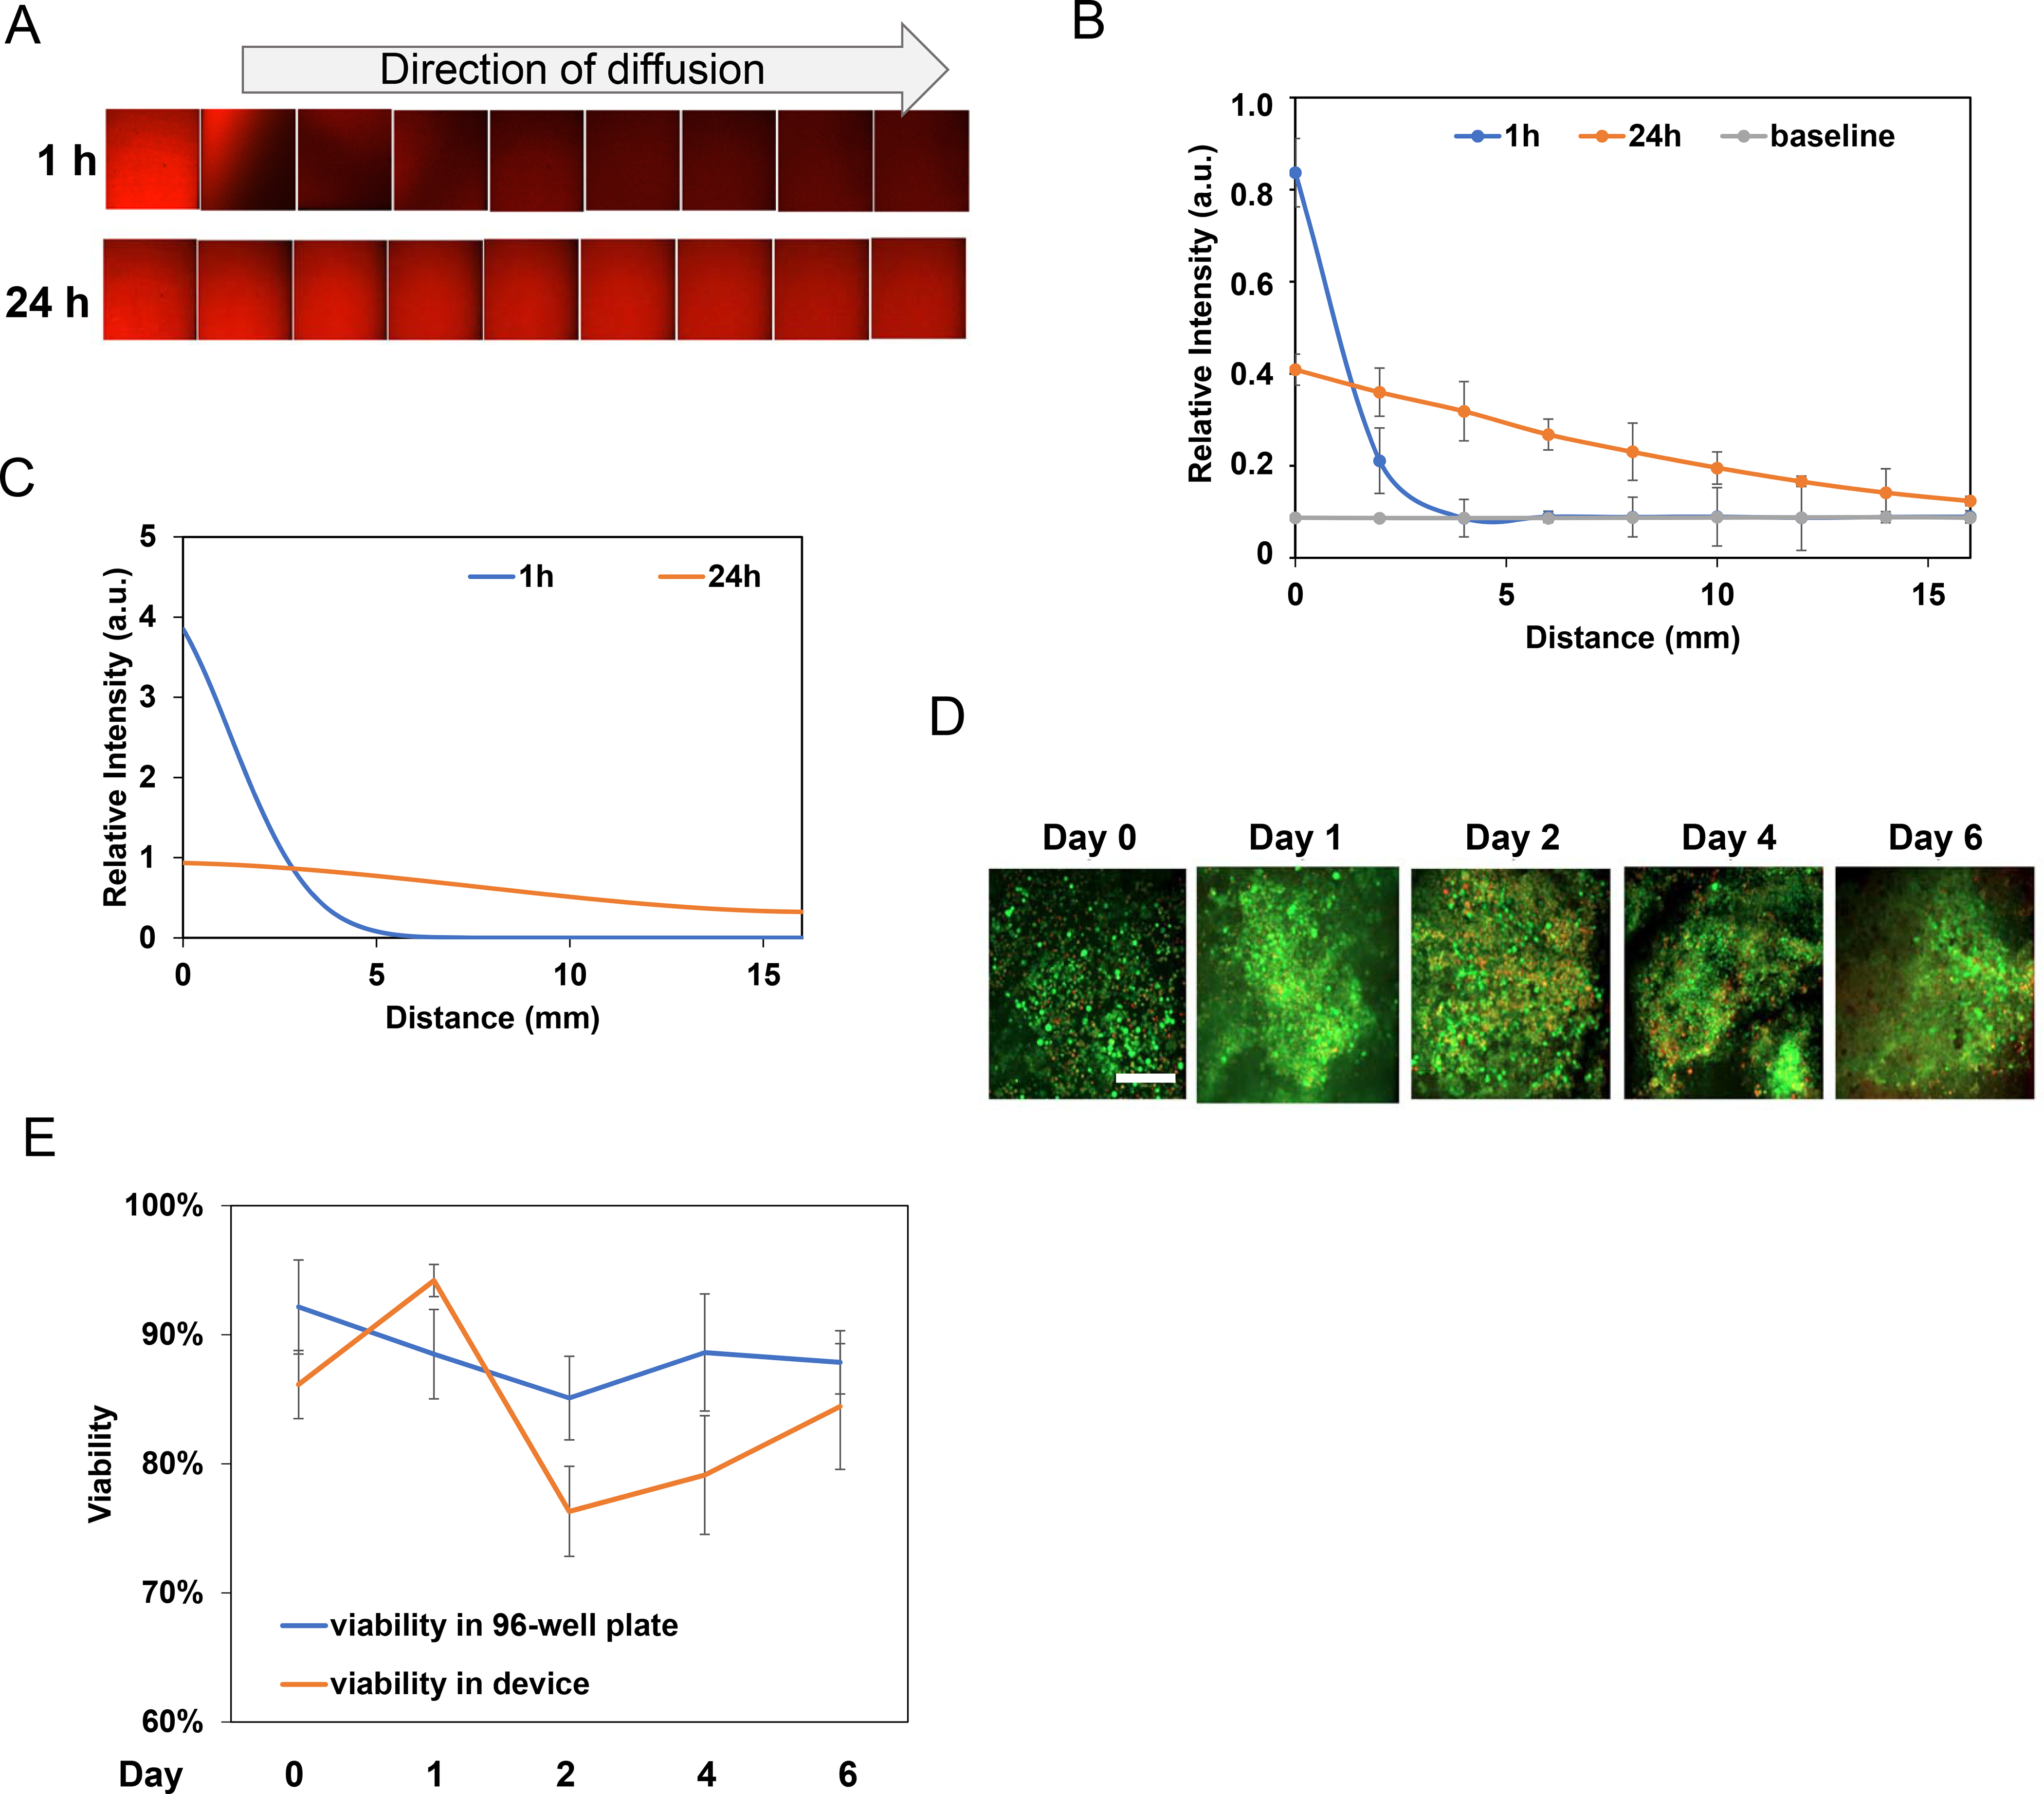
Figure 2. Diffusion profiles and cell viability in our ECM based systems.

A. A doxorubicin diffusion profile was captured through confocal microscopy imaging of doxorubicin fluorescent intensity at 1 and 24 h. B. Quantification of doxorubicin diffusion for 1 and 24 h. The grey line was the baseline fluorescence intensity without the presence of doxorubicin. C. 1D simulation of doxorubicin diffusion profile generated by applying the diffusion coefficient of doxorubicin from literature data. The simulation was similar to experimental results for the 1 and 24 h diffusion profiles. D. Viability tests for tumor samples cultured in 96-well plates and in our ECM tumor-on-a-chip device. E. Live/dead staining of tumor samples from Day 0 to Day 6, in 96-well plates and in our device. Scale bar: 200μm.
